| Full name: SWI/SNF related, matrix associated, actin dependent regulator of chromatin, subfamily e, member 1 | Alias Symbol: BAF57 | ||
| Type: protein-coding gene | Cytoband: 17q21.2 | ||
| Entrez ID: 6605 | HGNC ID: HGNC:11109 | Ensembl Gene: ENSG00000073584 | OMIM ID: 603111 |
Screen Evidence:
| |||
Expression of SMARCE1:
| Dataset | Gene | EntrezID | Probe | Log2FC | Adj.pValue | Expression |
|---|---|---|---|---|---|---|
| GSE17351 | SMARCE1 | 6605 | 211988_at | -0.3017 | 0.5422 | |
| GSE20347 | SMARCE1 | 6605 | 211988_at | -0.1407 | 0.4357 | |
| GSE23400 | SMARCE1 | 6605 | 211988_at | 0.0896 | 0.4117 | |
| GSE26886 | SMARCE1 | 6605 | 211988_at | 0.2594 | 0.3994 | |
| GSE29001 | SMARCE1 | 6605 | 211989_at | 0.4629 | 0.0390 | |
| GSE38129 | SMARCE1 | 6605 | 211988_at | -0.2412 | 0.0818 | |
| GSE45670 | SMARCE1 | 6605 | 211988_at | -0.4682 | 0.0191 | |
| GSE53622 | SMARCE1 | 6605 | 49915 | -0.3372 | 0.0000 | |
| GSE53624 | SMARCE1 | 6605 | 49915 | -0.1482 | 0.0221 | |
| GSE63941 | SMARCE1 | 6605 | 211989_at | 0.4805 | 0.4037 | |
| GSE77861 | SMARCE1 | 6605 | 211989_at | 0.5622 | 0.0076 | |
| GSE97050 | SMARCE1 | 6605 | A_23_P333063 | 0.1356 | 0.5746 | |
| SRP008496 | SMARCE1 | 6605 | RNAseq | 2.0585 | 0.0002 | |
| SRP064894 | SMARCE1 | 6605 | RNAseq | 0.1791 | 0.0578 | |
| SRP133303 | SMARCE1 | 6605 | RNAseq | 0.0776 | 0.4222 | |
| SRP159526 | SMARCE1 | 6605 | RNAseq | 0.0937 | 0.5471 | |
| SRP193095 | SMARCE1 | 6605 | RNAseq | -0.1011 | 0.2828 | |
| SRP219564 | SMARCE1 | 6605 | RNAseq | 0.1086 | 0.6443 | |
| TCGA | SMARCE1 | 6605 | RNAseq | 0.0524 | 0.2503 |
Upregulated datasets: 1; Downregulated datasets: 0.
Survival by SMARCE1 expression:
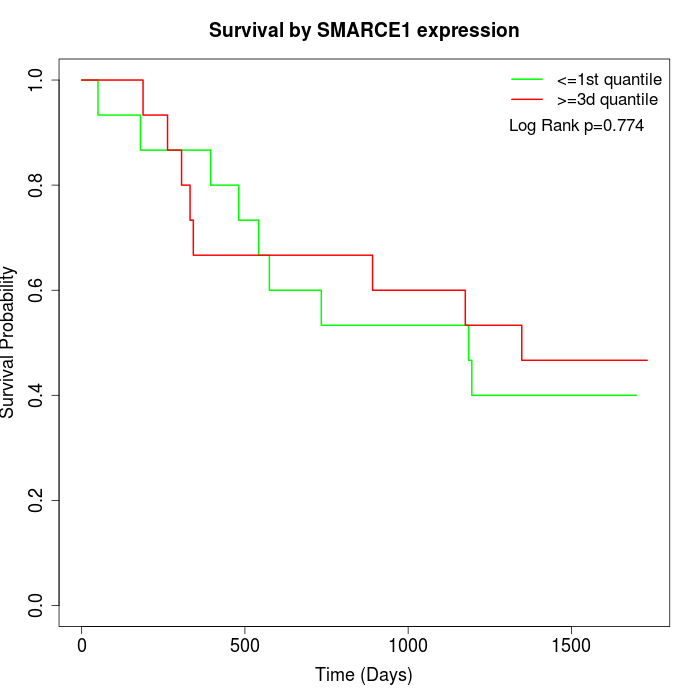 | 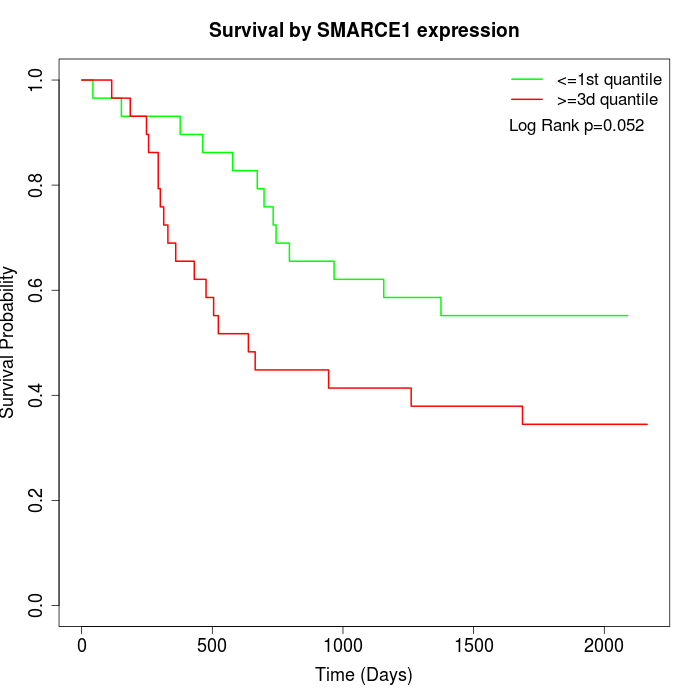 | 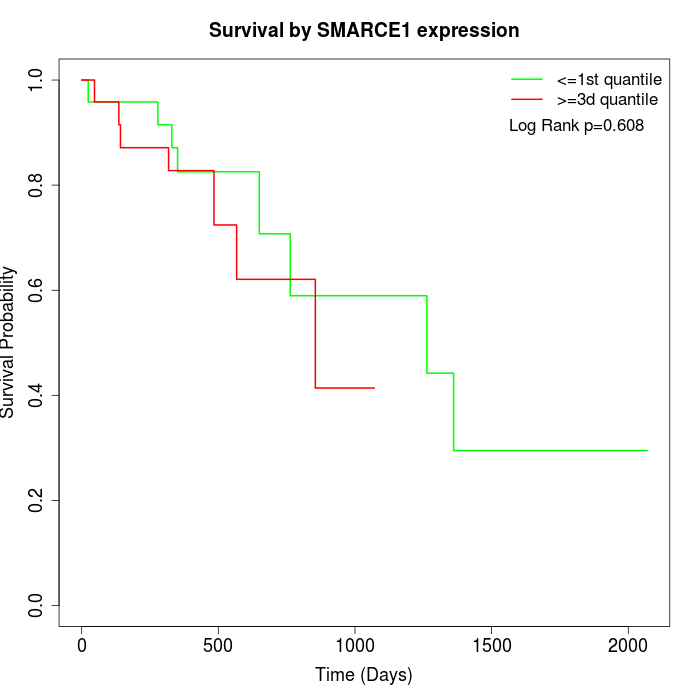 |
| GSE53622 | GSE53624 | TCGA |
Note: Click image to view full size file.
Copy number change of SMARCE1:
| Dataset | Gene | EntrezID | Gain | Loss | Normal | Detail |
|---|---|---|---|---|---|---|
| GSE15526 | SMARCE1 | 6605 | 7 | 1 | 22 | |
| GSE20123 | SMARCE1 | 6605 | 7 | 1 | 22 | |
| GSE43470 | SMARCE1 | 6605 | 1 | 2 | 40 | |
| GSE46452 | SMARCE1 | 6605 | 34 | 0 | 25 | |
| GSE47630 | SMARCE1 | 6605 | 8 | 1 | 31 | |
| GSE54993 | SMARCE1 | 6605 | 3 | 4 | 63 | |
| GSE54994 | SMARCE1 | 6605 | 8 | 5 | 40 | |
| GSE60625 | SMARCE1 | 6605 | 4 | 0 | 7 | |
| GSE74703 | SMARCE1 | 6605 | 1 | 1 | 34 | |
| GSE74704 | SMARCE1 | 6605 | 5 | 1 | 14 | |
| TCGA | SMARCE1 | 6605 | 23 | 8 | 65 |
Total number of gains: 101; Total number of losses: 24; Total Number of normals: 363.
Somatic mutations of SMARCE1:
Generating mutation plots.
Highly correlated genes for SMARCE1:
Showing top 20/555 corelated genes with mean PCC>0.5.
| Gene1 | Gene2 | Mean PCC | Num. Datasets | Num. PCC<0 | Num. PCC>0.5 |
|---|---|---|---|---|---|
| SMARCE1 | ISCA1 | 0.879536 | 3 | 0 | 3 |
| SMARCE1 | NCL | 0.802061 | 3 | 0 | 3 |
| SMARCE1 | STARD7 | 0.753451 | 4 | 0 | 4 |
| SMARCE1 | MKRN1 | 0.752844 | 3 | 0 | 3 |
| SMARCE1 | NFE2L1 | 0.750232 | 4 | 0 | 4 |
| SMARCE1 | HPS3 | 0.745047 | 3 | 0 | 3 |
| SMARCE1 | ALCAM | 0.743439 | 3 | 0 | 3 |
| SMARCE1 | PSMD4 | 0.743247 | 3 | 0 | 3 |
| SMARCE1 | RNF34 | 0.740104 | 3 | 0 | 3 |
| SMARCE1 | ZNF518B | 0.739587 | 3 | 0 | 3 |
| SMARCE1 | USP39 | 0.734118 | 4 | 0 | 3 |
| SMARCE1 | CDC26 | 0.729314 | 4 | 0 | 3 |
| SMARCE1 | RNF7 | 0.726219 | 4 | 0 | 4 |
| SMARCE1 | STRAP | 0.725744 | 3 | 0 | 3 |
| SMARCE1 | KANSL2 | 0.723275 | 4 | 0 | 3 |
| SMARCE1 | M6PR | 0.723043 | 3 | 0 | 3 |
| SMARCE1 | AIFM1 | 0.722703 | 3 | 0 | 3 |
| SMARCE1 | KDM3A | 0.721915 | 3 | 0 | 3 |
| SMARCE1 | CCNY | 0.721356 | 4 | 0 | 3 |
| SMARCE1 | BTG1 | 0.720339 | 4 | 0 | 3 |
For details and further investigation, click here