| Full name: Smad nuclear interacting protein 1 | Alias Symbol: PML1 | ||
| Type: protein-coding gene | Cytoband: 1p34.3 | ||
| Entrez ID: 79753 | HGNC ID: HGNC:30587 | Ensembl Gene: ENSG00000163877 | OMIM ID: 608241 |
Screen Evidence:
| |||
Expression of SNIP1:
| Dataset | Gene | EntrezID | Probe | Log2FC | Adj.pValue | Expression |
|---|---|---|---|---|---|---|
| GSE17351 | SNIP1 | 79753 | 235837_at | 0.0133 | 0.9822 | |
| GSE20347 | SNIP1 | 79753 | 219409_at | -0.0088 | 0.9472 | |
| GSE23400 | SNIP1 | 79753 | 219409_at | 0.0763 | 0.0689 | |
| GSE26886 | SNIP1 | 79753 | 219409_at | -1.0069 | 0.0000 | |
| GSE29001 | SNIP1 | 79753 | 219409_at | 0.0029 | 0.9878 | |
| GSE38129 | SNIP1 | 79753 | 219409_at | 0.0596 | 0.6142 | |
| GSE45670 | SNIP1 | 79753 | 219409_at | 0.1175 | 0.3201 | |
| GSE53622 | SNIP1 | 79753 | 150795 | -0.1656 | 0.0993 | |
| GSE53624 | SNIP1 | 79753 | 34737 | 0.2449 | 0.0009 | |
| GSE63941 | SNIP1 | 79753 | 219409_at | -0.1821 | 0.6070 | |
| GSE77861 | SNIP1 | 79753 | 219409_at | -0.0332 | 0.8429 | |
| GSE97050 | SNIP1 | 79753 | A_24_P276531 | -1.3163 | 0.2237 | |
| SRP007169 | SNIP1 | 79753 | RNAseq | -0.1283 | 0.8175 | |
| SRP008496 | SNIP1 | 79753 | RNAseq | 0.1531 | 0.7396 | |
| SRP064894 | SNIP1 | 79753 | RNAseq | -0.2689 | 0.0181 | |
| SRP133303 | SNIP1 | 79753 | RNAseq | 0.0862 | 0.4178 | |
| SRP159526 | SNIP1 | 79753 | RNAseq | -0.2478 | 0.3923 | |
| SRP193095 | SNIP1 | 79753 | RNAseq | -0.0452 | 0.5906 | |
| SRP219564 | SNIP1 | 79753 | RNAseq | -0.1671 | 0.6375 | |
| TCGA | SNIP1 | 79753 | RNAseq | -0.0093 | 0.8741 |
Upregulated datasets: 0; Downregulated datasets: 1.
Survival by SNIP1 expression:
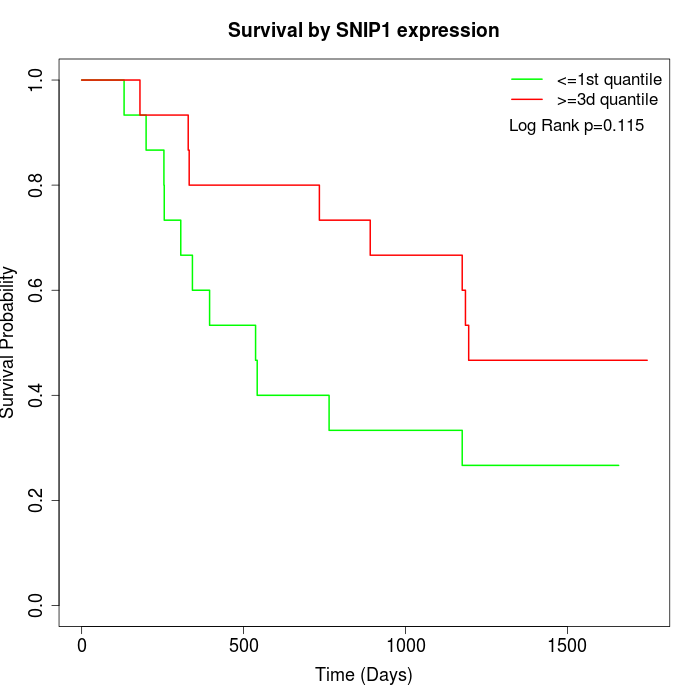 | 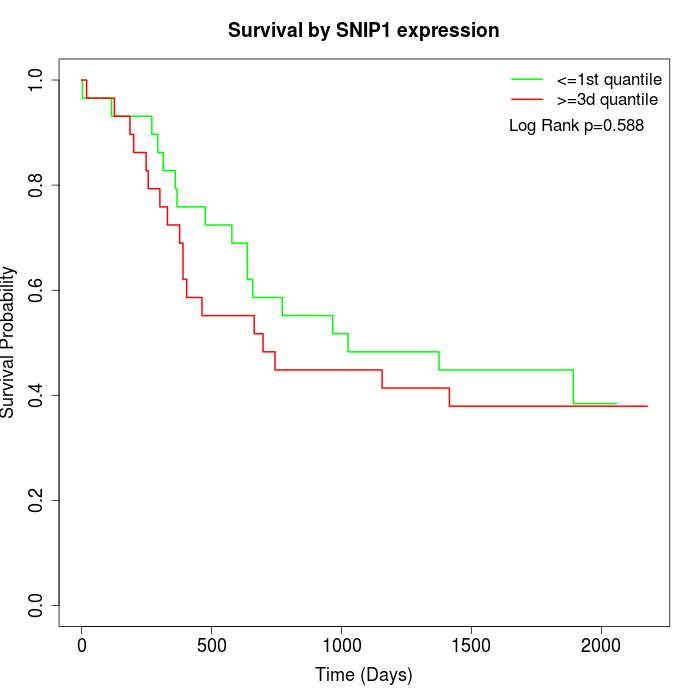 | 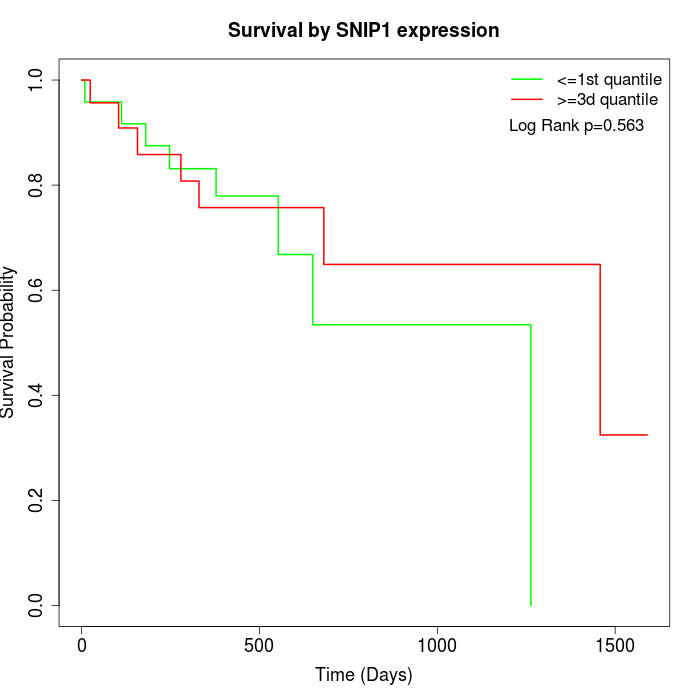 |
| GSE53622 | GSE53624 | TCGA |
Note: Click image to view full size file.
Copy number change of SNIP1:
| Dataset | Gene | EntrezID | Gain | Loss | Normal | Detail |
|---|---|---|---|---|---|---|
| GSE15526 | SNIP1 | 79753 | 2 | 4 | 24 | |
| GSE20123 | SNIP1 | 79753 | 2 | 3 | 25 | |
| GSE43470 | SNIP1 | 79753 | 7 | 3 | 33 | |
| GSE46452 | SNIP1 | 79753 | 4 | 1 | 54 | |
| GSE47630 | SNIP1 | 79753 | 8 | 3 | 29 | |
| GSE54993 | SNIP1 | 79753 | 1 | 1 | 68 | |
| GSE54994 | SNIP1 | 79753 | 11 | 2 | 40 | |
| GSE60625 | SNIP1 | 79753 | 0 | 0 | 11 | |
| GSE74703 | SNIP1 | 79753 | 6 | 2 | 28 | |
| GSE74704 | SNIP1 | 79753 | 1 | 0 | 19 | |
| TCGA | SNIP1 | 79753 | 12 | 16 | 68 |
Total number of gains: 54; Total number of losses: 35; Total Number of normals: 399.
Somatic mutations of SNIP1:
Generating mutation plots.
Highly correlated genes for SNIP1:
Showing top 20/163 corelated genes with mean PCC>0.5.
| Gene1 | Gene2 | Mean PCC | Num. Datasets | Num. PCC<0 | Num. PCC>0.5 |
|---|---|---|---|---|---|
| SNIP1 | ZNF626 | 0.792601 | 3 | 0 | 3 |
| SNIP1 | CTNNA1 | 0.715452 | 3 | 0 | 3 |
| SNIP1 | TAB3 | 0.711987 | 3 | 0 | 3 |
| SNIP1 | PIGN | 0.705308 | 3 | 0 | 3 |
| SNIP1 | RHBDD1 | 0.695265 | 3 | 0 | 3 |
| SNIP1 | ANXA11 | 0.691844 | 3 | 0 | 3 |
| SNIP1 | SSBP3 | 0.688971 | 4 | 0 | 4 |
| SNIP1 | ZNF436 | 0.688191 | 3 | 0 | 3 |
| SNIP1 | AKTIP | 0.684469 | 3 | 0 | 3 |
| SNIP1 | FBXO46 | 0.684442 | 3 | 0 | 3 |
| SNIP1 | PITHD1 | 0.679685 | 4 | 0 | 3 |
| SNIP1 | GPX3 | 0.678239 | 3 | 0 | 3 |
| SNIP1 | MTF1 | 0.660433 | 7 | 0 | 6 |
| SNIP1 | GNL3 | 0.656827 | 3 | 0 | 3 |
| SNIP1 | HIPK1 | 0.64412 | 3 | 0 | 3 |
| SNIP1 | ARRDC3 | 0.641934 | 3 | 0 | 3 |
| SNIP1 | GLYR1 | 0.636967 | 5 | 0 | 4 |
| SNIP1 | ARFIP1 | 0.634613 | 4 | 0 | 3 |
| SNIP1 | TRIM23 | 0.633708 | 4 | 0 | 4 |
| SNIP1 | SRI | 0.632146 | 4 | 0 | 3 |
For details and further investigation, click here