| Full name: SOS Ras/Rac guanine nucleotide exchange factor 1 | Alias Symbol: HGF|GF1 | ||
| Type: protein-coding gene | Cytoband: 2p22.1 | ||
| Entrez ID: 6654 | HGNC ID: HGNC:11187 | Ensembl Gene: ENSG00000115904 | OMIM ID: 182530 |
Screen Evidence:
| |||
SOS1 involved pathways:
Expression of SOS1:
| Dataset | Gene | EntrezID | Probe | Log2FC | Adj.pValue | Expression |
|---|---|---|---|---|---|---|
| GSE17351 | SOS1 | 6654 | 227426_at | -0.1290 | 0.7725 | |
| GSE20347 | SOS1 | 6654 | 212780_at | -0.1750 | 0.3374 | |
| GSE23400 | SOS1 | 6654 | 212777_at | -0.2623 | 0.0000 | |
| GSE26886 | SOS1 | 6654 | 212780_at | 0.1743 | 0.4442 | |
| GSE29001 | SOS1 | 6654 | 212780_at | -0.0396 | 0.8835 | |
| GSE38129 | SOS1 | 6654 | 212780_at | -0.0192 | 0.9092 | |
| GSE45670 | SOS1 | 6654 | 227426_at | -0.1403 | 0.3849 | |
| GSE53622 | SOS1 | 6654 | 38939 | 0.2260 | 0.0000 | |
| GSE53624 | SOS1 | 6654 | 38939 | -0.0018 | 0.9768 | |
| GSE63941 | SOS1 | 6654 | 227426_at | -0.4580 | 0.2069 | |
| GSE77861 | SOS1 | 6654 | 227426_at | -0.0138 | 0.9347 | |
| GSE97050 | SOS1 | 6654 | A_23_P343808 | 0.1628 | 0.5210 | |
| SRP007169 | SOS1 | 6654 | RNAseq | -0.1468 | 0.6516 | |
| SRP008496 | SOS1 | 6654 | RNAseq | -0.0110 | 0.9445 | |
| SRP064894 | SOS1 | 6654 | RNAseq | -0.3036 | 0.1775 | |
| SRP133303 | SOS1 | 6654 | RNAseq | 0.2015 | 0.1753 | |
| SRP159526 | SOS1 | 6654 | RNAseq | -0.0607 | 0.6925 | |
| SRP193095 | SOS1 | 6654 | RNAseq | -0.0508 | 0.4690 | |
| SRP219564 | SOS1 | 6654 | RNAseq | -0.1314 | 0.6537 | |
| TCGA | SOS1 | 6654 | RNAseq | -0.0949 | 0.0301 |
Upregulated datasets: 0; Downregulated datasets: 0.
Survival by SOS1 expression:
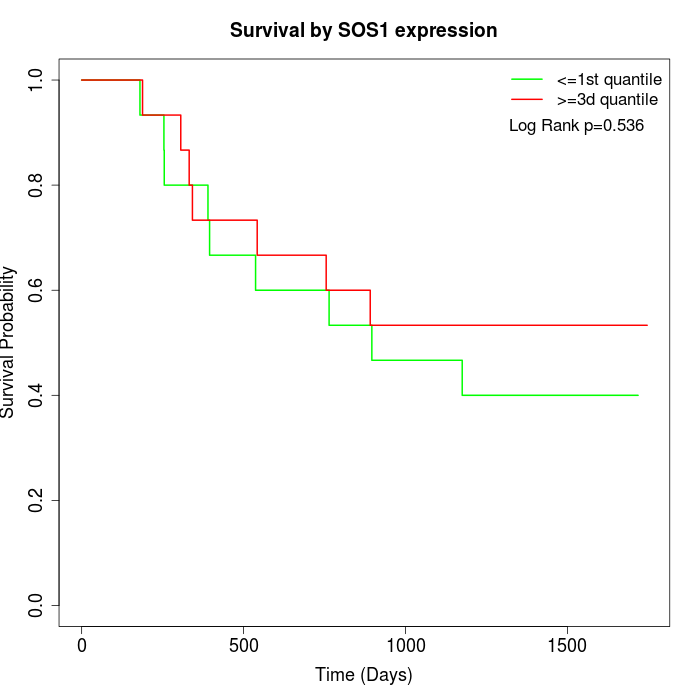 | 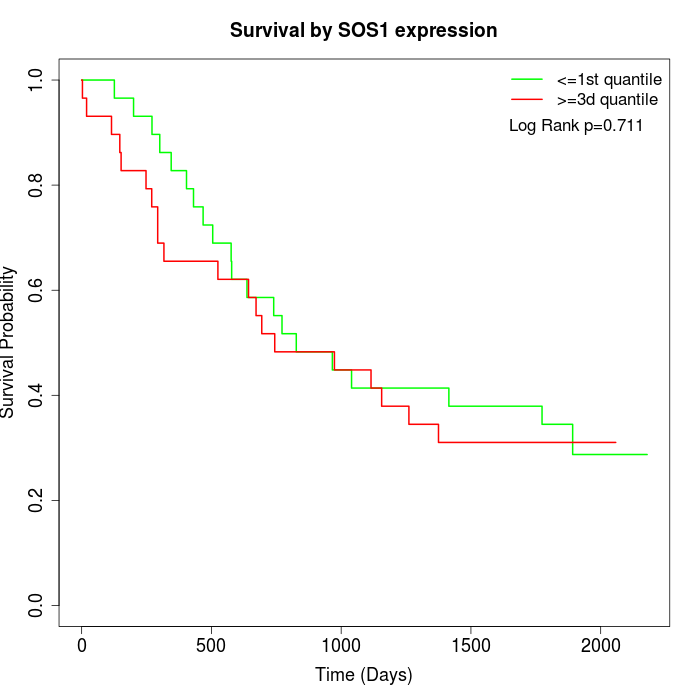 | 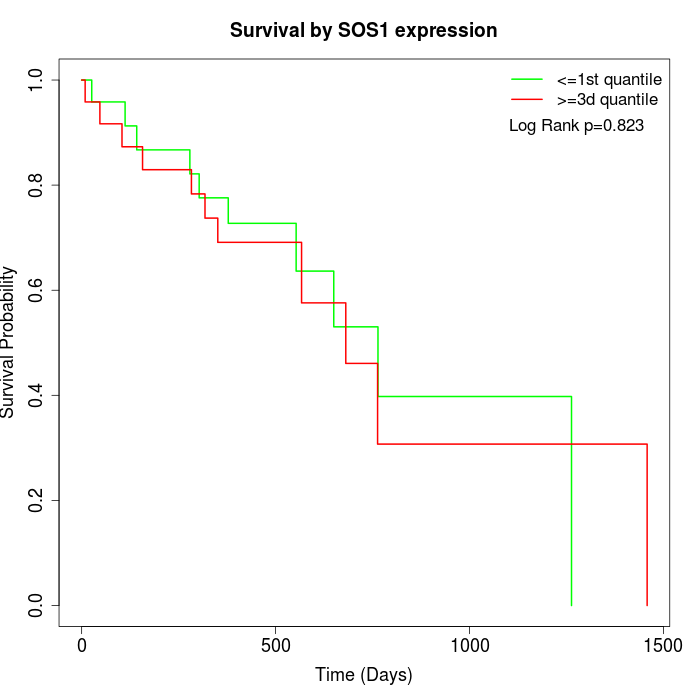 |
| GSE53622 | GSE53624 | TCGA |
Note: Click image to view full size file.
Copy number change of SOS1:
| Dataset | Gene | EntrezID | Gain | Loss | Normal | Detail |
|---|---|---|---|---|---|---|
| GSE15526 | SOS1 | 6654 | 11 | 1 | 18 | |
| GSE20123 | SOS1 | 6654 | 9 | 1 | 20 | |
| GSE43470 | SOS1 | 6654 | 3 | 0 | 40 | |
| GSE46452 | SOS1 | 6654 | 1 | 4 | 54 | |
| GSE47630 | SOS1 | 6654 | 7 | 0 | 33 | |
| GSE54993 | SOS1 | 6654 | 0 | 5 | 65 | |
| GSE54994 | SOS1 | 6654 | 10 | 0 | 43 | |
| GSE60625 | SOS1 | 6654 | 0 | 3 | 8 | |
| GSE74703 | SOS1 | 6654 | 3 | 0 | 33 | |
| GSE74704 | SOS1 | 6654 | 9 | 1 | 10 | |
| TCGA | SOS1 | 6654 | 35 | 2 | 59 |
Total number of gains: 88; Total number of losses: 17; Total Number of normals: 383.
Somatic mutations of SOS1:
Generating mutation plots.
Highly correlated genes for SOS1:
Showing top 20/219 corelated genes with mean PCC>0.5.
| Gene1 | Gene2 | Mean PCC | Num. Datasets | Num. PCC<0 | Num. PCC>0.5 |
|---|---|---|---|---|---|
| SOS1 | SLC25A3 | 0.743734 | 4 | 0 | 3 |
| SOS1 | DIS3L | 0.742651 | 3 | 0 | 3 |
| SOS1 | YIPF4 | 0.735698 | 3 | 0 | 3 |
| SOS1 | POLI | 0.733207 | 3 | 0 | 3 |
| SOS1 | RHOU | 0.723427 | 3 | 0 | 3 |
| SOS1 | CDC26 | 0.718279 | 3 | 0 | 3 |
| SOS1 | COG5 | 0.717065 | 3 | 0 | 3 |
| SOS1 | PRPF38A | 0.709409 | 3 | 0 | 3 |
| SOS1 | AP3M1 | 0.704909 | 3 | 0 | 3 |
| SOS1 | MDH2 | 0.703751 | 3 | 0 | 3 |
| SOS1 | DENND1B | 0.703705 | 3 | 0 | 3 |
| SOS1 | FAF2 | 0.702869 | 3 | 0 | 3 |
| SOS1 | NEK7 | 0.700571 | 3 | 0 | 3 |
| SOS1 | TNRC6B | 0.699302 | 4 | 0 | 3 |
| SOS1 | NHLRC2 | 0.699102 | 4 | 0 | 3 |
| SOS1 | SON | 0.693626 | 5 | 0 | 4 |
| SOS1 | SNAPC3 | 0.685101 | 3 | 0 | 3 |
| SOS1 | UBQLN2 | 0.684673 | 4 | 0 | 3 |
| SOS1 | CCT8 | 0.681142 | 3 | 0 | 3 |
| SOS1 | HDAC6 | 0.680557 | 3 | 0 | 3 |
For details and further investigation, click here