| Full name: stress induced phosphoprotein 1 | Alias Symbol: HOP|STI1 | ||
| Type: protein-coding gene | Cytoband: 11q13.1 | ||
| Entrez ID: 10963 | HGNC ID: HGNC:11387 | Ensembl Gene: ENSG00000168439 | OMIM ID: 605063 |
Screen Evidence:
| |||
STIP1 involved pathways:
| KEGG pathway | Description | View |
|---|---|---|
| hsa05020 | Prion diseases |
Expression of STIP1:
| Dataset | Gene | EntrezID | Probe | Log2FC | Adj.pValue | Expression |
|---|---|---|---|---|---|---|
| GSE17351 | STIP1 | 10963 | 213330_s_at | 0.7427 | 0.0152 | |
| GSE20347 | STIP1 | 10963 | 213330_s_at | 0.7882 | 0.0001 | |
| GSE23400 | STIP1 | 10963 | 213330_s_at | 0.7946 | 0.0000 | |
| GSE26886 | STIP1 | 10963 | 213330_s_at | 0.1350 | 0.4651 | |
| GSE29001 | STIP1 | 10963 | 213330_s_at | 0.3985 | 0.0481 | |
| GSE38129 | STIP1 | 10963 | 213330_s_at | 0.8440 | 0.0000 | |
| GSE45670 | STIP1 | 10963 | 213330_s_at | 0.9126 | 0.0002 | |
| GSE53622 | STIP1 | 10963 | 40565 | 0.8667 | 0.0000 | |
| GSE53624 | STIP1 | 10963 | 40565 | 0.9174 | 0.0000 | |
| GSE63941 | STIP1 | 10963 | 213330_s_at | 1.9366 | 0.0004 | |
| GSE77861 | STIP1 | 10963 | 213330_s_at | 0.6426 | 0.0053 | |
| GSE97050 | STIP1 | 10963 | A_32_P92783 | 0.3806 | 0.4116 | |
| SRP007169 | STIP1 | 10963 | RNAseq | 1.0130 | 0.0200 | |
| SRP008496 | STIP1 | 10963 | RNAseq | 1.0168 | 0.0008 | |
| SRP064894 | STIP1 | 10963 | RNAseq | 0.7029 | 0.0000 | |
| SRP133303 | STIP1 | 10963 | RNAseq | 0.7673 | 0.0000 | |
| SRP159526 | STIP1 | 10963 | RNAseq | 1.1321 | 0.0011 | |
| SRP193095 | STIP1 | 10963 | RNAseq | 0.7609 | 0.0000 | |
| SRP219564 | STIP1 | 10963 | RNAseq | 0.3379 | 0.5037 | |
| TCGA | STIP1 | 10963 | RNAseq | 0.2289 | 0.0000 |
Upregulated datasets: 4; Downregulated datasets: 0.
Survival by STIP1 expression:
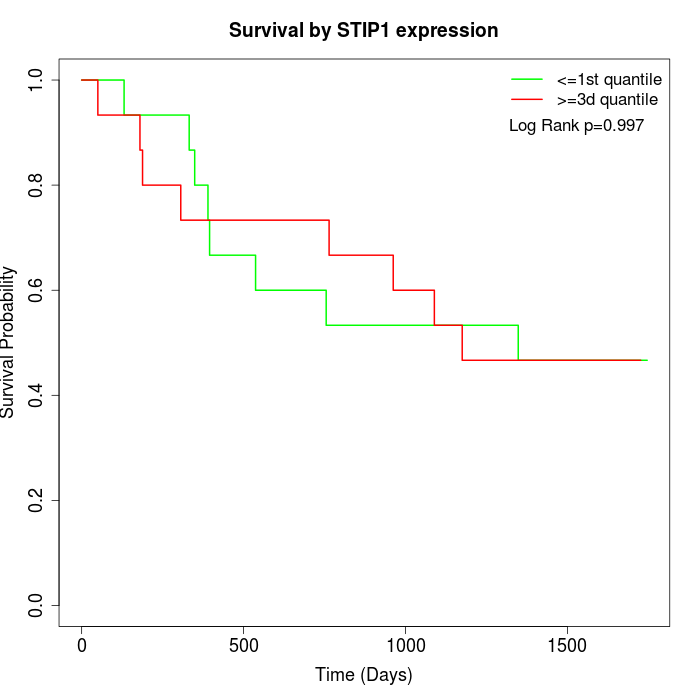 | 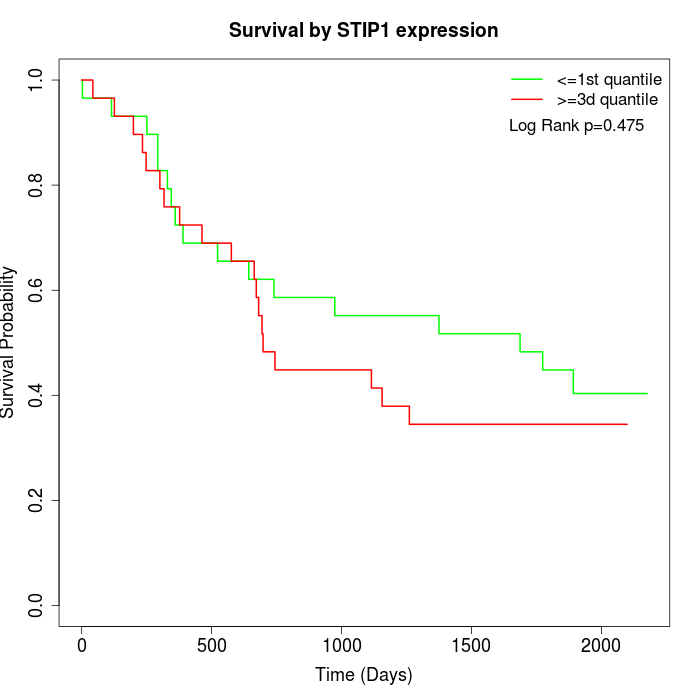 | 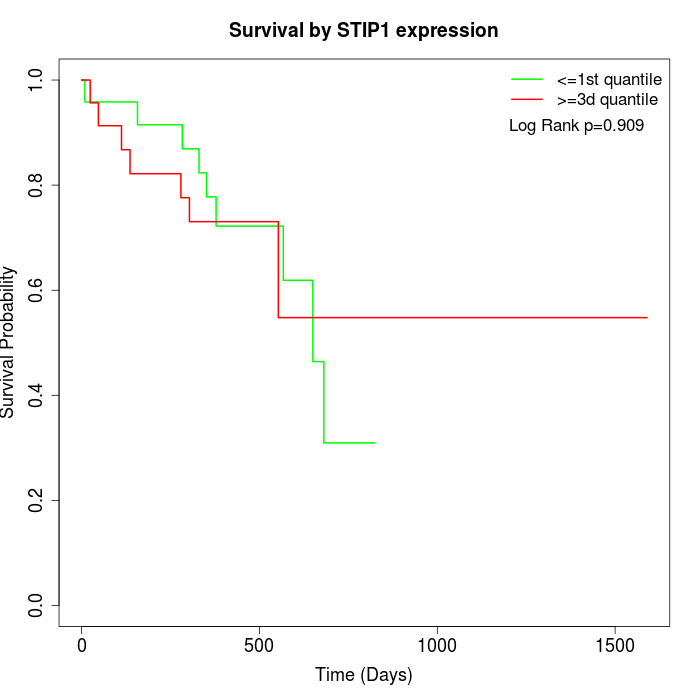 |
| GSE53622 | GSE53624 | TCGA |
Note: Click image to view full size file.
Copy number change of STIP1:
| Dataset | Gene | EntrezID | Gain | Loss | Normal | Detail |
|---|---|---|---|---|---|---|
| GSE15526 | STIP1 | 10963 | 6 | 5 | 19 | |
| GSE20123 | STIP1 | 10963 | 6 | 5 | 19 | |
| GSE43470 | STIP1 | 10963 | 1 | 3 | 39 | |
| GSE46452 | STIP1 | 10963 | 8 | 4 | 47 | |
| GSE47630 | STIP1 | 10963 | 3 | 7 | 30 | |
| GSE54993 | STIP1 | 10963 | 3 | 0 | 67 | |
| GSE54994 | STIP1 | 10963 | 5 | 5 | 43 | |
| GSE60625 | STIP1 | 10963 | 0 | 4 | 7 | |
| GSE74703 | STIP1 | 10963 | 1 | 1 | 34 | |
| GSE74704 | STIP1 | 10963 | 4 | 3 | 13 | |
| TCGA | STIP1 | 10963 | 19 | 10 | 67 |
Total number of gains: 56; Total number of losses: 47; Total Number of normals: 385.
Somatic mutations of STIP1:
Generating mutation plots.
Highly correlated genes for STIP1:
Showing top 20/1938 corelated genes with mean PCC>0.5.
| Gene1 | Gene2 | Mean PCC | Num. Datasets | Num. PCC<0 | Num. PCC>0.5 |
|---|---|---|---|---|---|
| STIP1 | SEMA4C | 0.806531 | 3 | 0 | 3 |
| STIP1 | OTUB1 | 0.764649 | 3 | 0 | 3 |
| STIP1 | SNRPG | 0.747981 | 9 | 0 | 9 |
| STIP1 | U2SURP | 0.747735 | 8 | 0 | 8 |
| STIP1 | AATF | 0.747599 | 11 | 0 | 10 |
| STIP1 | EBNA1BP2 | 0.747174 | 3 | 0 | 3 |
| STIP1 | CDKN3 | 0.745859 | 9 | 0 | 9 |
| STIP1 | PSMG3 | 0.74412 | 6 | 0 | 6 |
| STIP1 | YWHAG | 0.742205 | 5 | 0 | 4 |
| STIP1 | NOL11 | 0.74181 | 10 | 0 | 10 |
| STIP1 | RIOK1 | 0.739896 | 6 | 0 | 6 |
| STIP1 | UBE2C | 0.732129 | 11 | 0 | 11 |
| STIP1 | MASTL | 0.731991 | 5 | 0 | 5 |
| STIP1 | EME1 | 0.731811 | 5 | 0 | 5 |
| STIP1 | SPC25 | 0.7318 | 8 | 0 | 8 |
| STIP1 | CDCA2 | 0.730987 | 5 | 0 | 5 |
| STIP1 | HSPD1 | 0.728172 | 11 | 0 | 10 |
| STIP1 | TRMT112 | 0.727363 | 13 | 0 | 13 |
| STIP1 | ANAPC1 | 0.725887 | 3 | 0 | 3 |
| STIP1 | BANF1 | 0.725442 | 12 | 0 | 12 |
For details and further investigation, click here