| Full name: TBC1 domain family member 15 | Alias Symbol: FLJ12085|DKFZp761D0223 | ||
| Type: protein-coding gene | Cytoband: 12q21.1 | ||
| Entrez ID: 64786 | HGNC ID: HGNC:25694 | Ensembl Gene: ENSG00000121749 | OMIM ID: 612662 |
Expression of TBC1D15:
| Dataset | Gene | EntrezID | Probe | Log2FC | Adj.pValue | Expression |
|---|---|---|---|---|---|---|
| GSE17351 | TBC1D15 | 64786 | 218268_at | 0.0178 | 0.9766 | |
| GSE20347 | TBC1D15 | 64786 | 218268_at | 0.2178 | 0.2063 | |
| GSE23400 | TBC1D15 | 64786 | 218268_at | 0.1559 | 0.0026 | |
| GSE26886 | TBC1D15 | 64786 | 218268_at | -0.1237 | 0.6658 | |
| GSE29001 | TBC1D15 | 64786 | 218268_at | 0.1807 | 0.5949 | |
| GSE38129 | TBC1D15 | 64786 | 218268_at | 0.1109 | 0.3870 | |
| GSE45670 | TBC1D15 | 64786 | 218268_at | -0.1623 | 0.1957 | |
| GSE53622 | TBC1D15 | 64786 | 32510 | -0.1518 | 0.0097 | |
| GSE53624 | TBC1D15 | 64786 | 32510 | -0.0954 | 0.1241 | |
| GSE63941 | TBC1D15 | 64786 | 218268_at | -0.3484 | 0.5226 | |
| GSE77861 | TBC1D15 | 64786 | 218268_at | 0.2270 | 0.4765 | |
| GSE97050 | TBC1D15 | 64786 | A_23_P139558 | -0.0622 | 0.7694 | |
| SRP007169 | TBC1D15 | 64786 | RNAseq | -0.8034 | 0.0627 | |
| SRP008496 | TBC1D15 | 64786 | RNAseq | -0.8612 | 0.0007 | |
| SRP064894 | TBC1D15 | 64786 | RNAseq | -0.1713 | 0.3171 | |
| SRP133303 | TBC1D15 | 64786 | RNAseq | 0.1400 | 0.3244 | |
| SRP159526 | TBC1D15 | 64786 | RNAseq | -0.0634 | 0.7062 | |
| SRP193095 | TBC1D15 | 64786 | RNAseq | -0.3314 | 0.0164 | |
| SRP219564 | TBC1D15 | 64786 | RNAseq | -0.4456 | 0.0603 | |
| TCGA | TBC1D15 | 64786 | RNAseq | -0.0835 | 0.0996 |
Upregulated datasets: 0; Downregulated datasets: 0.
Survival by TBC1D15 expression:
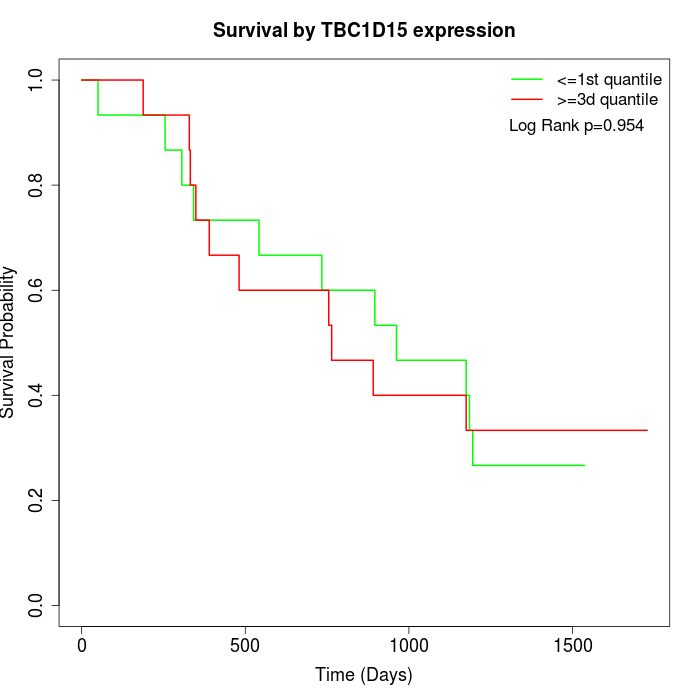 | 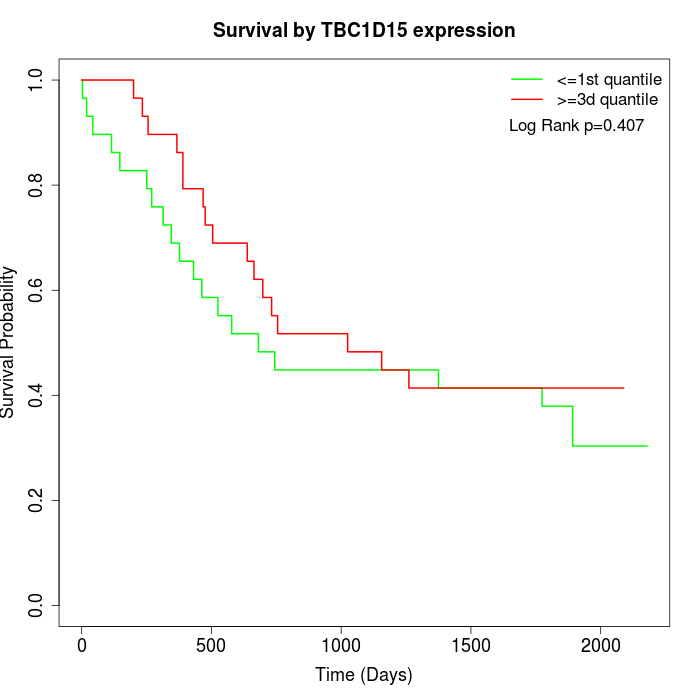 | 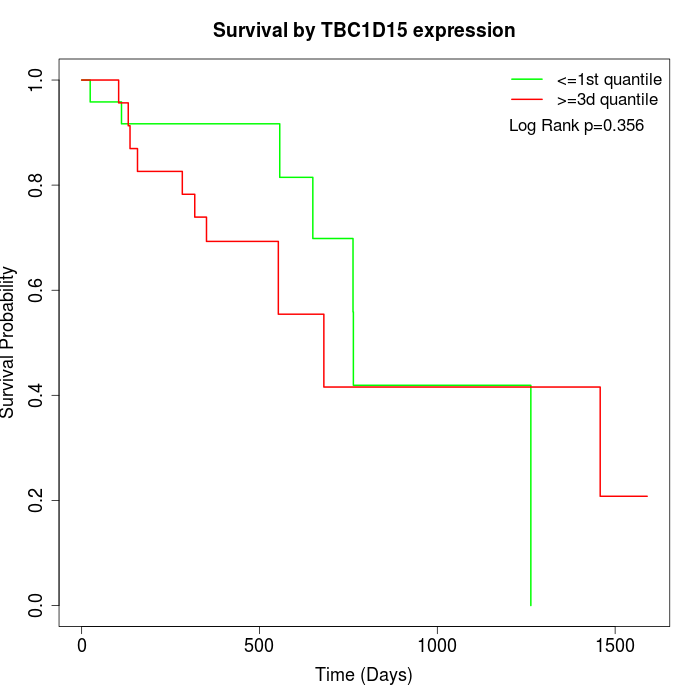 |
| GSE53622 | GSE53624 | TCGA |
Note: Click image to view full size file.
Copy number change of TBC1D15:
| Dataset | Gene | EntrezID | Gain | Loss | Normal | Detail |
|---|---|---|---|---|---|---|
| GSE15526 | TBC1D15 | 64786 | 4 | 3 | 23 | |
| GSE20123 | TBC1D15 | 64786 | 4 | 3 | 23 | |
| GSE43470 | TBC1D15 | 64786 | 3 | 0 | 40 | |
| GSE46452 | TBC1D15 | 64786 | 8 | 1 | 50 | |
| GSE47630 | TBC1D15 | 64786 | 10 | 1 | 29 | |
| GSE54993 | TBC1D15 | 64786 | 0 | 5 | 65 | |
| GSE54994 | TBC1D15 | 64786 | 7 | 1 | 45 | |
| GSE60625 | TBC1D15 | 64786 | 0 | 0 | 11 | |
| GSE74703 | TBC1D15 | 64786 | 3 | 0 | 33 | |
| GSE74704 | TBC1D15 | 64786 | 3 | 2 | 15 | |
| TCGA | TBC1D15 | 64786 | 21 | 9 | 66 |
Total number of gains: 63; Total number of losses: 25; Total Number of normals: 400.
Somatic mutations of TBC1D15:
Generating mutation plots.
Highly correlated genes for TBC1D15:
Showing top 20/156 corelated genes with mean PCC>0.5.
| Gene1 | Gene2 | Mean PCC | Num. Datasets | Num. PCC<0 | Num. PCC>0.5 |
|---|---|---|---|---|---|
| TBC1D15 | MFN1 | 0.75773 | 3 | 0 | 3 |
| TBC1D15 | NUP54 | 0.748026 | 4 | 0 | 4 |
| TBC1D15 | ATP8B1 | 0.729957 | 3 | 0 | 3 |
| TBC1D15 | TDP2 | 0.729751 | 3 | 0 | 3 |
| TBC1D15 | SDHAF2 | 0.723171 | 3 | 0 | 3 |
| TBC1D15 | TAS2R38 | 0.707655 | 3 | 0 | 3 |
| TBC1D15 | FKBP7 | 0.703674 | 3 | 0 | 3 |
| TBC1D15 | BRWD1 | 0.701548 | 3 | 0 | 3 |
| TBC1D15 | WTAP | 0.700718 | 4 | 0 | 3 |
| TBC1D15 | RAP1GDS1 | 0.693131 | 3 | 0 | 3 |
| TBC1D15 | SEC24D | 0.685508 | 3 | 0 | 3 |
| TBC1D15 | COQ10B | 0.682949 | 3 | 0 | 3 |
| TBC1D15 | PCMTD2 | 0.673881 | 5 | 0 | 5 |
| TBC1D15 | IFI44L | 0.673387 | 3 | 0 | 3 |
| TBC1D15 | CBFA2T2 | 0.671551 | 3 | 0 | 3 |
| TBC1D15 | KRR1 | 0.670236 | 5 | 0 | 5 |
| TBC1D15 | HSPA14 | 0.669212 | 3 | 0 | 3 |
| TBC1D15 | ZNF800 | 0.666701 | 3 | 0 | 3 |
| TBC1D15 | SKAP2 | 0.656102 | 3 | 0 | 3 |
| TBC1D15 | SRGN | 0.655459 | 3 | 0 | 3 |
For details and further investigation, click here