| Full name: transmembrane protein 8A | Alias Symbol: M83|PGAP6 | ||
| Type: protein-coding gene | Cytoband: 16p13.3 | ||
| Entrez ID: 58986 | HGNC ID: HGNC:17205 | Ensembl Gene: ENSG00000129925 | OMIM ID: |
Expression of TMEM8A:
| Dataset | Gene | EntrezID | Probe | Log2FC | Adj.pValue | Expression |
|---|---|---|---|---|---|---|
| GSE17351 | TMEM8A | 58986 | 221882_s_at | -0.5449 | 0.3379 | |
| GSE20347 | TMEM8A | 58986 | 221882_s_at | -0.9632 | 0.0001 | |
| GSE23400 | TMEM8A | 58986 | 221882_s_at | -0.6739 | 0.0000 | |
| GSE26886 | TMEM8A | 58986 | 222718_at | -0.2083 | 0.0855 | |
| GSE29001 | TMEM8A | 58986 | 221882_s_at | -1.0696 | 0.0002 | |
| GSE38129 | TMEM8A | 58986 | 221882_s_at | -0.8129 | 0.0000 | |
| GSE45670 | TMEM8A | 58986 | 221882_s_at | -0.2193 | 0.2962 | |
| GSE53622 | TMEM8A | 58986 | 85109 | -0.3348 | 0.0003 | |
| GSE53624 | TMEM8A | 58986 | 85109 | -0.6543 | 0.0000 | |
| GSE63941 | TMEM8A | 58986 | 221882_s_at | -0.9148 | 0.0713 | |
| GSE77861 | TMEM8A | 58986 | 222718_at | -0.2736 | 0.0063 | |
| GSE97050 | TMEM8A | 58986 | A_23_P140907 | 0.3066 | 0.6238 |
Upregulated datasets: 0; Downregulated datasets: 1.
Survival by TMEM8A expression:
 |  | 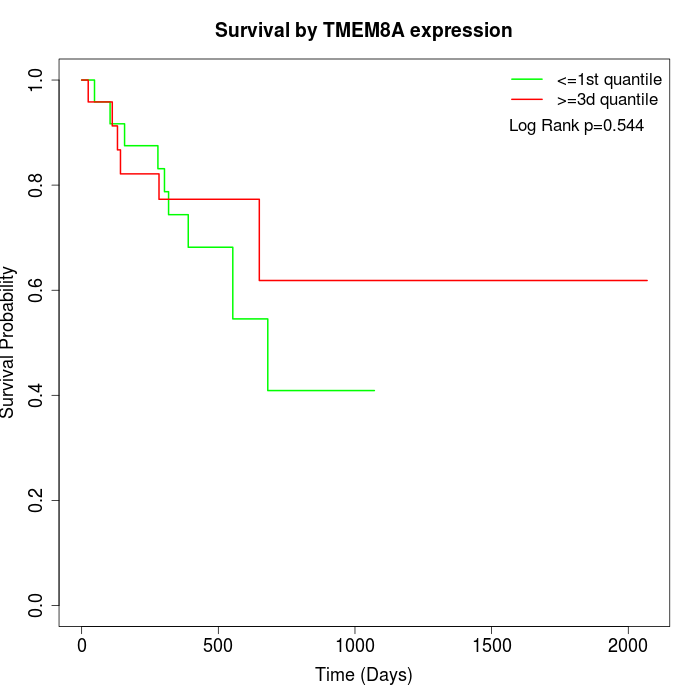 |
| GSE53622 | GSE53624 | TCGA |
Note: Click image to view full size file.
Copy number change of TMEM8A:
| Dataset | Gene | EntrezID | Gain | Loss | Normal | Detail |
|---|---|---|---|---|---|---|
| GSE15526 | TMEM8A | 58986 | 5 | 5 | 20 | |
| GSE20123 | TMEM8A | 58986 | 5 | 4 | 21 | |
| GSE43470 | TMEM8A | 58986 | 3 | 7 | 33 | |
| GSE46452 | TMEM8A | 58986 | 38 | 1 | 20 | |
| GSE47630 | TMEM8A | 58986 | 13 | 6 | 21 | |
| GSE54993 | TMEM8A | 58986 | 3 | 5 | 62 | |
| GSE54994 | TMEM8A | 58986 | 4 | 10 | 39 | |
| GSE60625 | TMEM8A | 58986 | 4 | 0 | 7 | |
| GSE74703 | TMEM8A | 58986 | 3 | 5 | 28 | |
| GSE74704 | TMEM8A | 58986 | 3 | 2 | 15 | |
| TCGA | TMEM8A | 58986 | 20 | 15 | 61 |
Total number of gains: 101; Total number of losses: 60; Total Number of normals: 327.
Somatic mutations of TMEM8A:
Generating mutation plots.
Highly correlated genes for TMEM8A:
Showing top 20/719 corelated genes with mean PCC>0.5.
| Gene1 | Gene2 | Mean PCC | Num. Datasets | Num. PCC<0 | Num. PCC>0.5 |
|---|---|---|---|---|---|
| TMEM8A | ATP6V1C2 | 0.68656 | 5 | 0 | 4 |
| TMEM8A | SH3GLB1 | 0.681002 | 8 | 0 | 7 |
| TMEM8A | SH3GL1 | 0.680216 | 11 | 0 | 11 |
| TMEM8A | MTERF4 | 0.679014 | 7 | 0 | 6 |
| TMEM8A | ACTR3C | 0.670596 | 3 | 0 | 3 |
| TMEM8A | AGFG2 | 0.668848 | 9 | 0 | 7 |
| TMEM8A | ACOX3 | 0.662723 | 7 | 0 | 6 |
| TMEM8A | PKNOX2 | 0.661952 | 3 | 0 | 3 |
| TMEM8A | ELOVL1 | 0.658963 | 3 | 0 | 3 |
| TMEM8A | GDPD3 | 0.654291 | 10 | 0 | 9 |
| TMEM8A | CRYL1 | 0.651164 | 9 | 0 | 8 |
| TMEM8A | SPNS2 | 0.651138 | 5 | 0 | 5 |
| TMEM8A | FNDC4 | 0.651112 | 11 | 0 | 9 |
| TMEM8A | UBL3 | 0.650515 | 9 | 0 | 8 |
| TMEM8A | B3GALT4 | 0.649797 | 7 | 0 | 5 |
| TMEM8A | VAT1 | 0.64914 | 11 | 0 | 9 |
| TMEM8A | TIMP2 | 0.648564 | 6 | 0 | 4 |
| TMEM8A | PSCA | 0.648378 | 8 | 0 | 8 |
| TMEM8A | MAPK3 | 0.646405 | 11 | 0 | 9 |
| TMEM8A | UBE2D3 | 0.64496 | 3 | 0 | 3 |
For details and further investigation, click here