| Full name: DNA topoisomerase I | Alias Symbol: | ||
| Type: protein-coding gene | Cytoband: 20q12 | ||
| Entrez ID: 7150 | HGNC ID: HGNC:11986 | Ensembl Gene: ENSG00000198900 | OMIM ID: 126420 |
| Related drugs: 7-ETHYL-10-HYDROXY-CAMPTOTHECIN, BECATECARIN, C-1311 (CHEMBL3545337), CAFFEINE, CAMPTOTHECIN, CYCLOPHOSPHAMIDE, ETIRINOTECAN PEGOL, IRINOTECAN, IRINOTECAN HYDROCHLORIDE HYDRATE, IRINOTECAN SUCROSOFATE... [more] | |||
Screen Evidence:
| |||
Expression of TOP1:
| Dataset | Gene | EntrezID | Probe | Log2FC | Adj.pValue | Expression |
|---|---|---|---|---|---|---|
| GSE17351 | TOP1 | 7150 | 208901_s_at | 0.8659 | 0.0396 | |
| GSE20347 | TOP1 | 7150 | 208901_s_at | 0.3206 | 0.0124 | |
| GSE23400 | TOP1 | 7150 | 208901_s_at | 0.1911 | 0.0018 | |
| GSE26886 | TOP1 | 7150 | 208901_s_at | -0.4002 | 0.0019 | |
| GSE29001 | TOP1 | 7150 | 208901_s_at | 0.2785 | 0.1956 | |
| GSE38129 | TOP1 | 7150 | 208901_s_at | 0.3814 | 0.0078 | |
| GSE45670 | TOP1 | 7150 | 208901_s_at | 0.3780 | 0.0056 | |
| GSE53622 | TOP1 | 7150 | 61126 | 0.5876 | 0.0000 | |
| GSE53624 | TOP1 | 7150 | 61126 | 0.4485 | 0.0000 | |
| GSE63941 | TOP1 | 7150 | 208901_s_at | -0.1577 | 0.7521 | |
| GSE77861 | TOP1 | 7150 | 208901_s_at | 0.2832 | 0.0314 | |
| GSE97050 | TOP1 | 7150 | A_33_P3371493 | 0.4338 | 0.3146 | |
| SRP007169 | TOP1 | 7150 | RNAseq | 0.7427 | 0.1594 | |
| SRP008496 | TOP1 | 7150 | RNAseq | 0.5638 | 0.0860 | |
| SRP064894 | TOP1 | 7150 | RNAseq | -0.0984 | 0.7103 | |
| SRP133303 | TOP1 | 7150 | RNAseq | 0.4666 | 0.0004 | |
| SRP159526 | TOP1 | 7150 | RNAseq | 0.1215 | 0.5734 | |
| SRP193095 | TOP1 | 7150 | RNAseq | -0.2089 | 0.0585 | |
| SRP219564 | TOP1 | 7150 | RNAseq | 0.3737 | 0.3861 | |
| TCGA | TOP1 | 7150 | RNAseq | 0.0219 | 0.6051 |
Upregulated datasets: 0; Downregulated datasets: 0.
Survival by TOP1 expression:
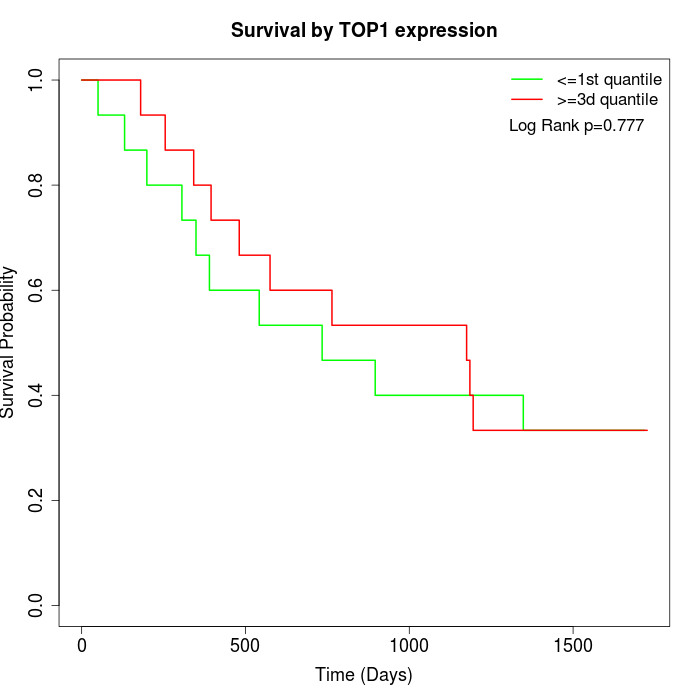 | 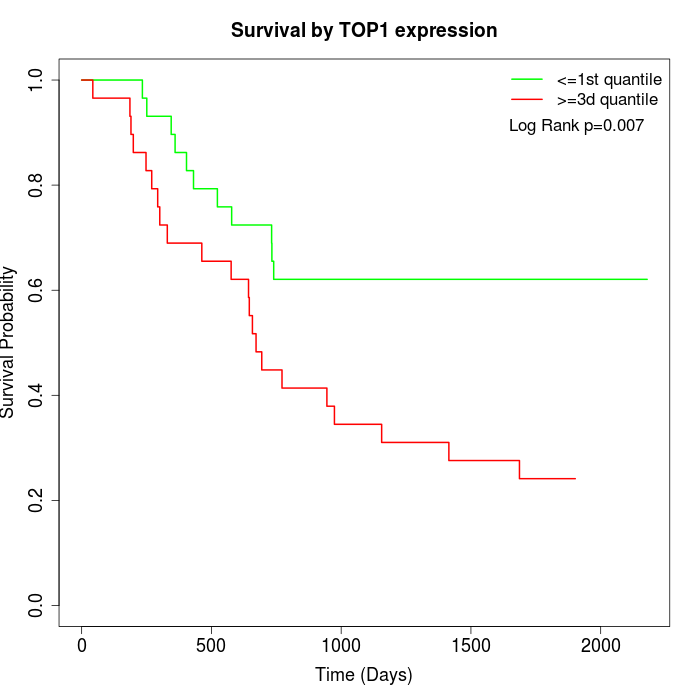 | 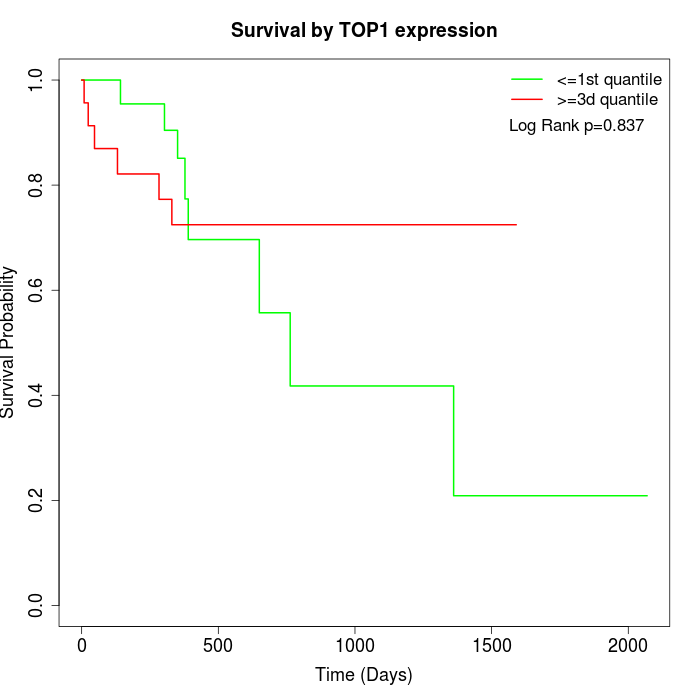 |
| GSE53622 | GSE53624 | TCGA |
Note: Click image to view full size file.
Copy number change of TOP1:
| Dataset | Gene | EntrezID | Gain | Loss | Normal | Detail |
|---|---|---|---|---|---|---|
| GSE15526 | TOP1 | 7150 | 13 | 1 | 16 | |
| GSE20123 | TOP1 | 7150 | 13 | 1 | 16 | |
| GSE43470 | TOP1 | 7150 | 13 | 0 | 30 | |
| GSE46452 | TOP1 | 7150 | 29 | 0 | 30 | |
| GSE47630 | TOP1 | 7150 | 24 | 0 | 16 | |
| GSE54993 | TOP1 | 7150 | 0 | 17 | 53 | |
| GSE54994 | TOP1 | 7150 | 24 | 0 | 29 | |
| GSE60625 | TOP1 | 7150 | 0 | 0 | 11 | |
| GSE74703 | TOP1 | 7150 | 10 | 0 | 26 | |
| GSE74704 | TOP1 | 7150 | 9 | 0 | 11 | |
| TCGA | TOP1 | 7150 | 45 | 5 | 46 |
Total number of gains: 180; Total number of losses: 24; Total Number of normals: 284.
Somatic mutations of TOP1:
Generating mutation plots.
Highly correlated genes for TOP1:
Showing top 20/557 corelated genes with mean PCC>0.5.
| Gene1 | Gene2 | Mean PCC | Num. Datasets | Num. PCC<0 | Num. PCC>0.5 |
|---|---|---|---|---|---|
| TOP1 | DDX27 | 0.708955 | 9 | 0 | 8 |
| TOP1 | EIF1AD | 0.69856 | 3 | 0 | 3 |
| TOP1 | ZGPAT | 0.689961 | 5 | 0 | 5 |
| TOP1 | C1orf74 | 0.685691 | 3 | 0 | 3 |
| TOP1 | CEP85 | 0.678793 | 5 | 0 | 4 |
| TOP1 | RAD21 | 0.673047 | 3 | 0 | 3 |
| TOP1 | LY6K | 0.669756 | 4 | 0 | 3 |
| TOP1 | ESCO2 | 0.668421 | 6 | 0 | 5 |
| TOP1 | UTP15 | 0.662802 | 3 | 0 | 3 |
| TOP1 | RAE1 | 0.660322 | 10 | 0 | 9 |
| TOP1 | SOCS7 | 0.658081 | 4 | 0 | 3 |
| TOP1 | RCC2 | 0.652444 | 5 | 0 | 5 |
| TOP1 | KCNS2 | 0.652092 | 3 | 0 | 3 |
| TOP1 | UXS1 | 0.651412 | 3 | 0 | 3 |
| TOP1 | GMEB2 | 0.65109 | 8 | 0 | 8 |
| TOP1 | CENPBD1 | 0.650248 | 3 | 0 | 3 |
| TOP1 | TLCD1 | 0.648867 | 3 | 0 | 3 |
| TOP1 | RNF149 | 0.647992 | 4 | 0 | 3 |
| TOP1 | YTHDF1 | 0.647971 | 10 | 0 | 7 |
| TOP1 | PEX13 | 0.647633 | 4 | 0 | 3 |
For details and further investigation, click here