| Full name: teashirt zinc finger homeobox 2 | Alias Symbol: ZABC2|OVC10-2|TSH2 | ||
| Type: protein-coding gene | Cytoband: 20q13.2 | ||
| Entrez ID: 128553 | HGNC ID: HGNC:13010 | Ensembl Gene: ENSG00000182463 | OMIM ID: 614118 |
Expression of TSHZ2:
| Dataset | Gene | EntrezID | Probe | Log2FC | Adj.pValue | Expression |
|---|---|---|---|---|---|---|
| GSE17351 | TSHZ2 | 128553 | 235616_at | -0.6373 | 0.1334 | |
| GSE20347 | TSHZ2 | 128553 | 220213_at | -0.2113 | 0.0303 | |
| GSE23400 | TSHZ2 | 128553 | 220213_at | -0.1552 | 0.0002 | |
| GSE26886 | TSHZ2 | 128553 | 220213_at | -0.2316 | 0.2535 | |
| GSE29001 | TSHZ2 | 128553 | 220213_at | -0.4316 | 0.1851 | |
| GSE38129 | TSHZ2 | 128553 | 220213_at | -0.2878 | 0.0005 | |
| GSE45670 | TSHZ2 | 128553 | 220213_at | -0.2328 | 0.0567 | |
| GSE53622 | TSHZ2 | 128553 | 106280 | -0.0043 | 0.9857 | |
| GSE53624 | TSHZ2 | 128553 | 106280 | -0.6676 | 0.0001 | |
| GSE63941 | TSHZ2 | 128553 | 220213_at | -0.3578 | 0.3639 | |
| GSE77861 | TSHZ2 | 128553 | 220213_at | 0.0246 | 0.8771 | |
| GSE97050 | TSHZ2 | 128553 | A_23_P143247 | 0.3876 | 0.4557 | |
| SRP007169 | TSHZ2 | 128553 | RNAseq | 0.2029 | 0.6566 | |
| SRP008496 | TSHZ2 | 128553 | RNAseq | 0.0969 | 0.7610 | |
| SRP064894 | TSHZ2 | 128553 | RNAseq | 0.1054 | 0.7071 | |
| SRP133303 | TSHZ2 | 128553 | RNAseq | -0.0051 | 0.9741 | |
| SRP159526 | TSHZ2 | 128553 | RNAseq | -0.5597 | 0.0890 | |
| SRP193095 | TSHZ2 | 128553 | RNAseq | 0.2165 | 0.2780 | |
| SRP219564 | TSHZ2 | 128553 | RNAseq | -0.5879 | 0.2480 | |
| TCGA | TSHZ2 | 128553 | RNAseq | -0.3338 | 0.0314 |
Upregulated datasets: 0; Downregulated datasets: 0.
Survival by TSHZ2 expression:
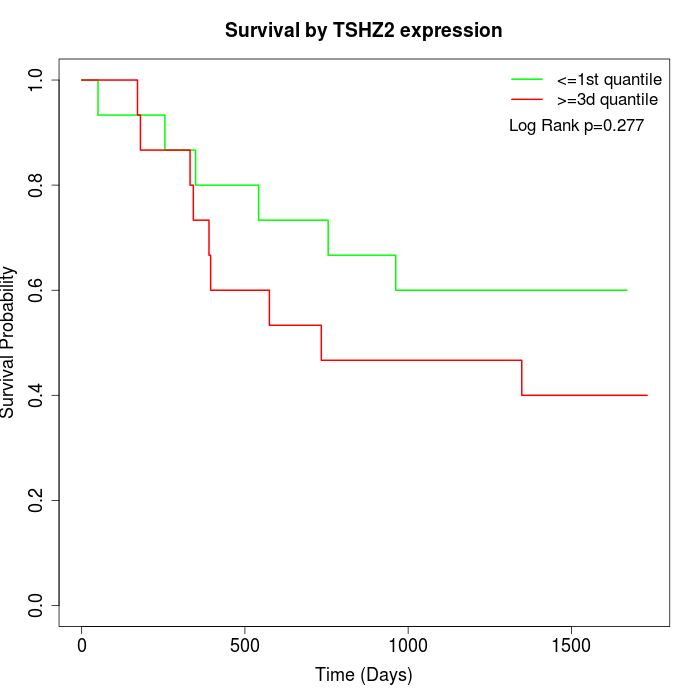 | 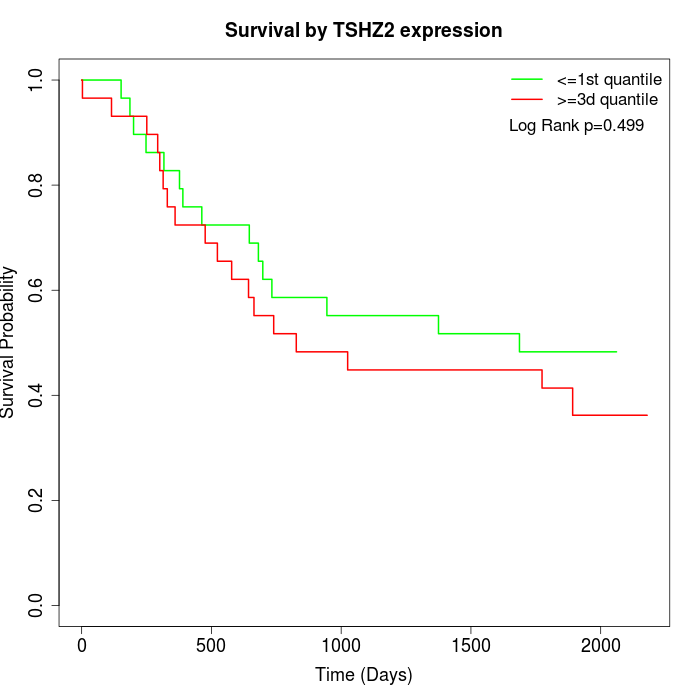 | 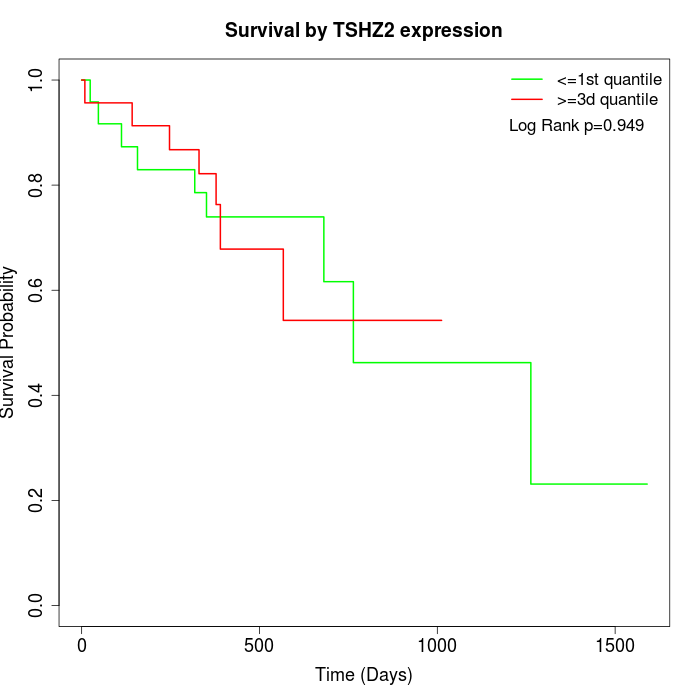 |
| GSE53622 | GSE53624 | TCGA |
Note: Click image to view full size file.
Copy number change of TSHZ2:
| Dataset | Gene | EntrezID | Gain | Loss | Normal | Detail |
|---|---|---|---|---|---|---|
| GSE15526 | TSHZ2 | 128553 | 16 | 2 | 12 | |
| GSE20123 | TSHZ2 | 128553 | 16 | 2 | 12 | |
| GSE43470 | TSHZ2 | 128553 | 14 | 0 | 29 | |
| GSE46452 | TSHZ2 | 128553 | 29 | 0 | 30 | |
| GSE47630 | TSHZ2 | 128553 | 24 | 1 | 15 | |
| GSE54993 | TSHZ2 | 128553 | 0 | 17 | 53 | |
| GSE54994 | TSHZ2 | 128553 | 27 | 0 | 26 | |
| GSE60625 | TSHZ2 | 128553 | 0 | 0 | 11 | |
| GSE74703 | TSHZ2 | 128553 | 11 | 0 | 25 | |
| GSE74704 | TSHZ2 | 128553 | 12 | 0 | 8 | |
| TCGA | TSHZ2 | 128553 | 45 | 3 | 48 |
Total number of gains: 194; Total number of losses: 25; Total Number of normals: 269.
Somatic mutations of TSHZ2:
Generating mutation plots.
Highly correlated genes for TSHZ2:
Showing top 20/302 corelated genes with mean PCC>0.5.
| Gene1 | Gene2 | Mean PCC | Num. Datasets | Num. PCC<0 | Num. PCC>0.5 |
|---|---|---|---|---|---|
| TSHZ2 | ARRDC3 | 0.761115 | 3 | 0 | 3 |
| TSHZ2 | FAM117B | 0.74412 | 3 | 0 | 3 |
| TSHZ2 | MYCN | 0.732746 | 3 | 0 | 3 |
| TSHZ2 | MLLT10 | 0.723957 | 3 | 0 | 3 |
| TSHZ2 | TMUB2 | 0.696497 | 3 | 0 | 3 |
| TSHZ2 | TSPYL4 | 0.691589 | 3 | 0 | 3 |
| TSHZ2 | AUH | 0.689695 | 3 | 0 | 3 |
| TSHZ2 | COMMD1 | 0.689126 | 3 | 0 | 3 |
| TSHZ2 | EMCN | 0.686894 | 3 | 0 | 3 |
| TSHZ2 | APPBP2 | 0.685439 | 4 | 0 | 4 |
| TSHZ2 | RANBP10 | 0.684685 | 3 | 0 | 3 |
| TSHZ2 | ICK | 0.684521 | 3 | 0 | 3 |
| TSHZ2 | CREB3L2 | 0.678088 | 3 | 0 | 3 |
| TSHZ2 | LRIG3 | 0.675417 | 4 | 0 | 3 |
| TSHZ2 | MTUS1 | 0.666747 | 4 | 0 | 4 |
| TSHZ2 | BDKRB2 | 0.666496 | 3 | 0 | 3 |
| TSHZ2 | CYP3A43 | 0.654835 | 4 | 0 | 4 |
| TSHZ2 | MAPK3 | 0.652698 | 4 | 0 | 4 |
| TSHZ2 | ELFN1 | 0.652396 | 3 | 0 | 3 |
| TSHZ2 | POLD4 | 0.6519 | 4 | 0 | 3 |
For details and further investigation, click here