| Full name: RAN binding protein 10 | Alias Symbol: KIAA1464 | ||
| Type: protein-coding gene | Cytoband: 16q22 | ||
| Entrez ID: 57610 | HGNC ID: HGNC:29285 | Ensembl Gene: ENSG00000141084 | OMIM ID: 614031 |
Expression of RANBP10:
| Dataset | Gene | EntrezID | Probe | Log2FC | Adj.pValue | Expression |
|---|---|---|---|---|---|---|
| GSE17351 | RANBP10 | 57610 | 221809_at | -0.0310 | 0.9477 | |
| GSE20347 | RANBP10 | 57610 | 221809_at | -0.0312 | 0.7470 | |
| GSE23400 | RANBP10 | 57610 | 53987_at | -0.0616 | 0.0762 | |
| GSE26886 | RANBP10 | 57610 | 53987_at | -0.2638 | 0.1845 | |
| GSE29001 | RANBP10 | 57610 | 53987_at | -0.2119 | 0.1060 | |
| GSE38129 | RANBP10 | 57610 | 221809_at | -0.0326 | 0.7215 | |
| GSE45670 | RANBP10 | 57610 | 221809_at | 0.2037 | 0.0624 | |
| GSE53622 | RANBP10 | 57610 | 3274 | -0.2063 | 0.0020 | |
| GSE53624 | RANBP10 | 57610 | 3274 | -0.0353 | 0.4958 | |
| GSE63941 | RANBP10 | 57610 | 221809_at | 0.1347 | 0.6877 | |
| GSE77861 | RANBP10 | 57610 | 221809_at | 0.0806 | 0.6575 | |
| GSE97050 | RANBP10 | 57610 | A_23_P369733 | -0.0847 | 0.6699 | |
| SRP007169 | RANBP10 | 57610 | RNAseq | -1.4609 | 0.0000 | |
| SRP008496 | RANBP10 | 57610 | RNAseq | -1.4726 | 0.0000 | |
| SRP064894 | RANBP10 | 57610 | RNAseq | -0.6127 | 0.0000 | |
| SRP133303 | RANBP10 | 57610 | RNAseq | -0.1144 | 0.4866 | |
| SRP159526 | RANBP10 | 57610 | RNAseq | -0.0851 | 0.8431 | |
| SRP193095 | RANBP10 | 57610 | RNAseq | -0.0209 | 0.8571 | |
| SRP219564 | RANBP10 | 57610 | RNAseq | -0.6437 | 0.0123 | |
| TCGA | RANBP10 | 57610 | RNAseq | -0.0192 | 0.7014 |
Upregulated datasets: 0; Downregulated datasets: 2.
Survival by RANBP10 expression:
 | 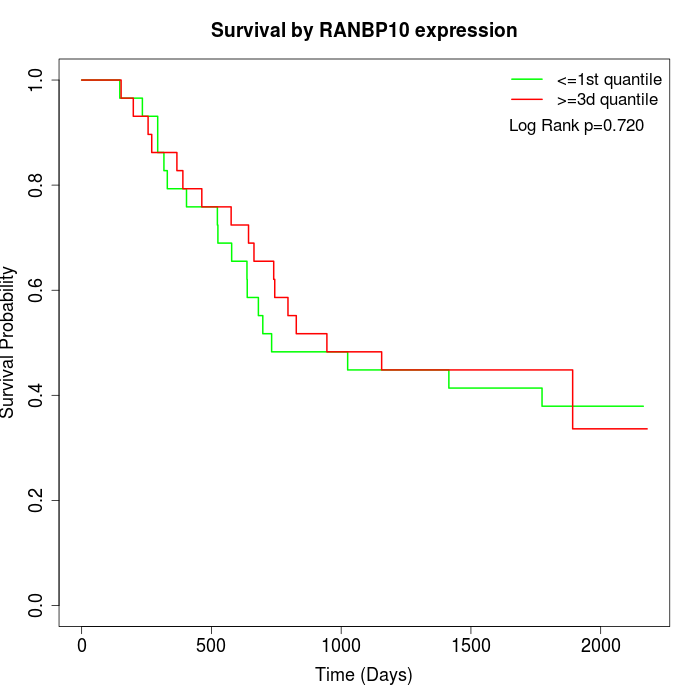 | 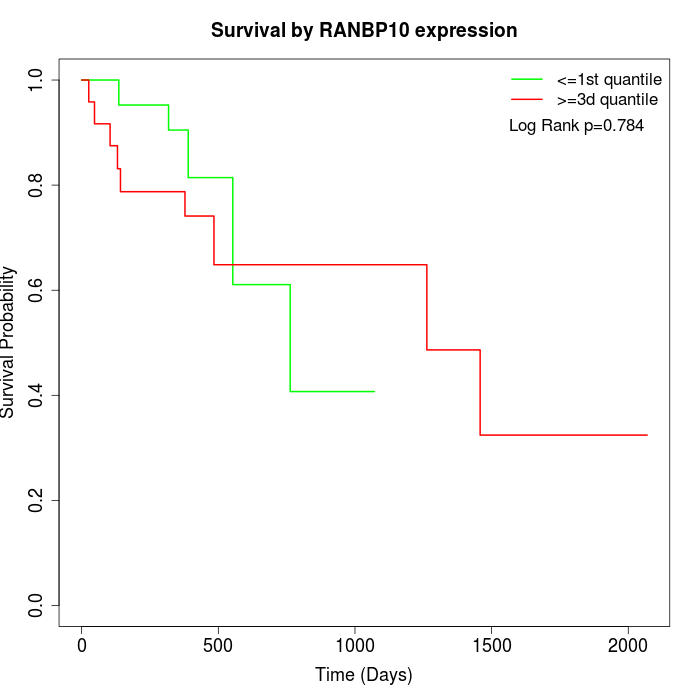 |
| GSE53622 | GSE53624 | TCGA |
Note: Click image to view full size file.
Copy number change of RANBP10:
| Dataset | Gene | EntrezID | Gain | Loss | Normal | Detail |
|---|---|---|---|---|---|---|
| GSE15526 | RANBP10 | 57610 | 9 | 2 | 19 | |
| GSE20123 | RANBP10 | 57610 | 9 | 2 | 19 | |
| GSE43470 | RANBP10 | 57610 | 1 | 9 | 33 | |
| GSE46452 | RANBP10 | 57610 | 38 | 1 | 20 | |
| GSE47630 | RANBP10 | 57610 | 11 | 8 | 21 | |
| GSE54993 | RANBP10 | 57610 | 2 | 4 | 64 | |
| GSE54994 | RANBP10 | 57610 | 8 | 10 | 35 | |
| GSE60625 | RANBP10 | 57610 | 4 | 0 | 7 | |
| GSE74703 | RANBP10 | 57610 | 1 | 6 | 29 | |
| GSE74704 | RANBP10 | 57610 | 5 | 1 | 14 | |
| TCGA | RANBP10 | 57610 | 28 | 13 | 55 |
Total number of gains: 116; Total number of losses: 56; Total Number of normals: 316.
Somatic mutations of RANBP10:
Generating mutation plots.
Highly correlated genes for RANBP10:
Showing top 20/154 corelated genes with mean PCC>0.5.
| Gene1 | Gene2 | Mean PCC | Num. Datasets | Num. PCC<0 | Num. PCC>0.5 |
|---|---|---|---|---|---|
| RANBP10 | CNR1 | 0.780407 | 3 | 0 | 3 |
| RANBP10 | SMPD1 | 0.740597 | 3 | 0 | 3 |
| RANBP10 | ARHGAP17 | 0.736444 | 4 | 0 | 4 |
| RANBP10 | CWC25 | 0.714684 | 3 | 0 | 3 |
| RANBP10 | MAPK6 | 0.711834 | 3 | 0 | 3 |
| RANBP10 | EPB41 | 0.711104 | 3 | 0 | 3 |
| RANBP10 | PPP1R11 | 0.700003 | 3 | 0 | 3 |
| RANBP10 | GALNT1 | 0.691535 | 3 | 0 | 3 |
| RANBP10 | PRADC1 | 0.68734 | 3 | 0 | 3 |
| RANBP10 | ARCN1 | 0.685245 | 3 | 0 | 3 |
| RANBP10 | TSHZ2 | 0.684685 | 3 | 0 | 3 |
| RANBP10 | NAA20 | 0.680811 | 3 | 0 | 3 |
| RANBP10 | PFKFB2 | 0.675862 | 3 | 0 | 3 |
| RANBP10 | TPMT | 0.669549 | 3 | 0 | 3 |
| RANBP10 | TPM3 | 0.668771 | 3 | 0 | 3 |
| RANBP10 | ADAM11 | 0.66826 | 3 | 0 | 3 |
| RANBP10 | GCDH | 0.666424 | 3 | 0 | 3 |
| RANBP10 | ARL8B | 0.663628 | 3 | 0 | 3 |
| RANBP10 | TBL1Y | 0.663503 | 3 | 0 | 3 |
| RANBP10 | PHLPP1 | 0.662556 | 4 | 0 | 3 |
For details and further investigation, click here