| Full name: unc-119 lipid binding chaperone B | Alias Symbol: MGC5139|POC7B | ||
| Type: protein-coding gene | Cytoband: 12q24.31 | ||
| Entrez ID: 84747 | HGNC ID: HGNC:16488 | Ensembl Gene: ENSG00000175970 | OMIM ID: |
Expression of UNC119B:
| Dataset | Gene | EntrezID | Probe | Log2FC | Adj.pValue | Expression |
|---|---|---|---|---|---|---|
| GSE17351 | UNC119B | 84747 | 202365_at | 0.9002 | 0.0958 | |
| GSE20347 | UNC119B | 84747 | 202365_at | -0.0032 | 0.9856 | |
| GSE23400 | UNC119B | 84747 | 202365_at | 0.2093 | 0.0003 | |
| GSE26886 | UNC119B | 84747 | 202365_at | -0.6177 | 0.0055 | |
| GSE29001 | UNC119B | 84747 | 202365_at | 0.1339 | 0.6835 | |
| GSE38129 | UNC119B | 84747 | 202365_at | 0.0343 | 0.8083 | |
| GSE45670 | UNC119B | 84747 | 202365_at | 0.1788 | 0.1251 | |
| GSE53622 | UNC119B | 84747 | 29059 | 0.2169 | 0.0596 | |
| GSE53624 | UNC119B | 84747 | 29059 | 0.2945 | 0.0020 | |
| GSE63941 | UNC119B | 84747 | 202365_at | 0.0240 | 0.9442 | |
| GSE77861 | UNC119B | 84747 | 202365_at | 0.1023 | 0.7096 | |
| GSE97050 | UNC119B | 84747 | A_23_P87827 | 0.0507 | 0.8862 | |
| SRP007169 | UNC119B | 84747 | RNAseq | 0.0935 | 0.7936 | |
| SRP008496 | UNC119B | 84747 | RNAseq | 0.4330 | 0.0705 | |
| SRP064894 | UNC119B | 84747 | RNAseq | 0.0648 | 0.6347 | |
| SRP133303 | UNC119B | 84747 | RNAseq | -0.1474 | 0.3918 | |
| SRP159526 | UNC119B | 84747 | RNAseq | 0.3118 | 0.1729 | |
| SRP193095 | UNC119B | 84747 | RNAseq | 0.1088 | 0.2326 | |
| SRP219564 | UNC119B | 84747 | RNAseq | -0.2820 | 0.3309 | |
| TCGA | UNC119B | 84747 | RNAseq | -0.1591 | 0.0149 |
Upregulated datasets: 0; Downregulated datasets: 0.
Survival by UNC119B expression:
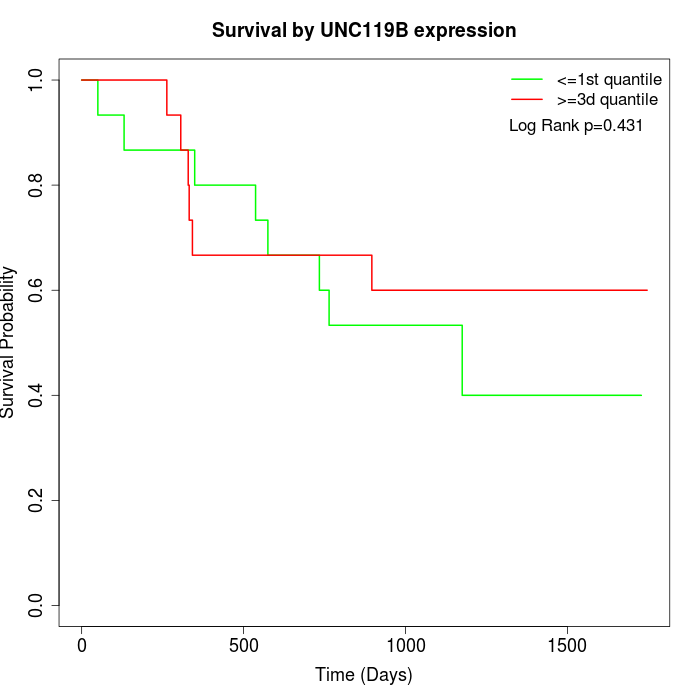 |  |  |
| GSE53622 | GSE53624 | TCGA |
Note: Click image to view full size file.
Copy number change of UNC119B:
| Dataset | Gene | EntrezID | Gain | Loss | Normal | Detail |
|---|---|---|---|---|---|---|
| GSE15526 | UNC119B | 84747 | 6 | 2 | 22 | |
| GSE20123 | UNC119B | 84747 | 6 | 2 | 22 | |
| GSE43470 | UNC119B | 84747 | 2 | 2 | 39 | |
| GSE46452 | UNC119B | 84747 | 9 | 1 | 49 | |
| GSE47630 | UNC119B | 84747 | 9 | 3 | 28 | |
| GSE54993 | UNC119B | 84747 | 0 | 5 | 65 | |
| GSE54994 | UNC119B | 84747 | 7 | 6 | 40 | |
| GSE60625 | UNC119B | 84747 | 0 | 0 | 11 | |
| GSE74703 | UNC119B | 84747 | 2 | 1 | 33 | |
| GSE74704 | UNC119B | 84747 | 3 | 2 | 15 | |
| TCGA | UNC119B | 84747 | 20 | 11 | 65 |
Total number of gains: 64; Total number of losses: 35; Total Number of normals: 389.
Somatic mutations of UNC119B:
Generating mutation plots.
Highly correlated genes for UNC119B:
Showing top 20/304 corelated genes with mean PCC>0.5.
| Gene1 | Gene2 | Mean PCC | Num. Datasets | Num. PCC<0 | Num. PCC>0.5 |
|---|---|---|---|---|---|
| UNC119B | NR2C2 | 0.727908 | 3 | 0 | 3 |
| UNC119B | KCTD15 | 0.719447 | 3 | 0 | 3 |
| UNC119B | RNF13 | 0.71233 | 3 | 0 | 3 |
| UNC119B | NEURL1B | 0.703775 | 3 | 0 | 3 |
| UNC119B | PARL | 0.694073 | 3 | 0 | 3 |
| UNC119B | EMP2 | 0.68783 | 3 | 0 | 3 |
| UNC119B | IP6K1 | 0.681969 | 3 | 0 | 3 |
| UNC119B | SWT1 | 0.680335 | 3 | 0 | 3 |
| UNC119B | HDAC1 | 0.675489 | 3 | 0 | 3 |
| UNC119B | TTC4 | 0.672709 | 3 | 0 | 3 |
| UNC119B | C2CD2 | 0.666149 | 3 | 0 | 3 |
| UNC119B | FAM102B | 0.665903 | 3 | 0 | 3 |
| UNC119B | DDX20 | 0.663417 | 3 | 0 | 3 |
| UNC119B | PQBP1 | 0.663209 | 3 | 0 | 3 |
| UNC119B | MIB1 | 0.661709 | 4 | 0 | 3 |
| UNC119B | ATG4C | 0.657714 | 3 | 0 | 3 |
| UNC119B | NDUFS2 | 0.653164 | 5 | 0 | 4 |
| UNC119B | TPD52 | 0.651767 | 4 | 0 | 3 |
| UNC119B | RIOK2 | 0.647777 | 3 | 0 | 3 |
| UNC119B | SBNO1 | 0.645158 | 5 | 0 | 4 |
For details and further investigation, click here