| Full name: ubiquitin specific peptidase 16 | Alias Symbol: Ubp-M | ||
| Type: protein-coding gene | Cytoband: 21q21 | ||
| Entrez ID: 10600 | HGNC ID: HGNC:12614 | Ensembl Gene: ENSG00000156256 | OMIM ID: 604735 |
Screen Evidence:
| |||
Expression of USP16:
| Dataset | Gene | EntrezID | Probe | Log2FC | Adj.pValue | Expression |
|---|---|---|---|---|---|---|
| GSE17351 | USP16 | 10600 | 218386_x_at | -0.5820 | 0.1535 | |
| GSE20347 | USP16 | 10600 | 218386_x_at | -0.4916 | 0.0000 | |
| GSE23400 | USP16 | 10600 | 218386_x_at | -0.1308 | 0.0821 | |
| GSE26886 | USP16 | 10600 | 218386_x_at | -1.0334 | 0.0000 | |
| GSE29001 | USP16 | 10600 | 218386_x_at | -0.1706 | 0.6512 | |
| GSE38129 | USP16 | 10600 | 218386_x_at | -0.4632 | 0.0000 | |
| GSE45670 | USP16 | 10600 | 218386_x_at | -0.5010 | 0.0008 | |
| GSE53622 | USP16 | 10600 | 88953 | -0.4396 | 0.0000 | |
| GSE53624 | USP16 | 10600 | 41522 | -0.2577 | 0.0000 | |
| GSE63941 | USP16 | 10600 | 218386_x_at | -0.6063 | 0.1607 | |
| GSE77861 | USP16 | 10600 | 228822_s_at | -0.5278 | 0.0316 | |
| GSE97050 | USP16 | 10600 | A_33_P3325439 | -0.5011 | 0.1286 | |
| SRP007169 | USP16 | 10600 | RNAseq | -1.1862 | 0.0003 | |
| SRP008496 | USP16 | 10600 | RNAseq | -0.7795 | 0.0002 | |
| SRP064894 | USP16 | 10600 | RNAseq | -0.4253 | 0.0329 | |
| SRP133303 | USP16 | 10600 | RNAseq | -0.3263 | 0.0206 | |
| SRP159526 | USP16 | 10600 | RNAseq | -0.4619 | 0.1854 | |
| SRP193095 | USP16 | 10600 | RNAseq | -0.6003 | 0.0000 | |
| SRP219564 | USP16 | 10600 | RNAseq | -0.7439 | 0.0060 | |
| TCGA | USP16 | 10600 | RNAseq | -0.1606 | 0.0008 |
Upregulated datasets: 0; Downregulated datasets: 2.
Survival by USP16 expression:
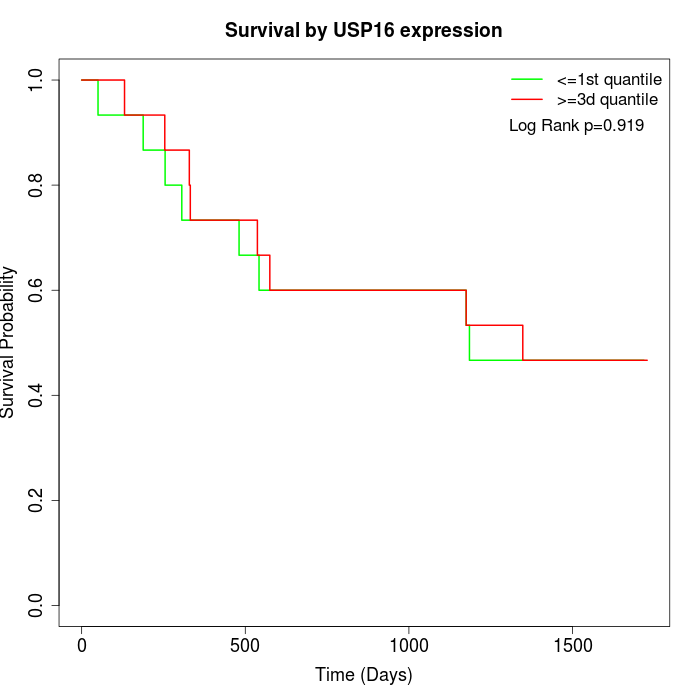 | 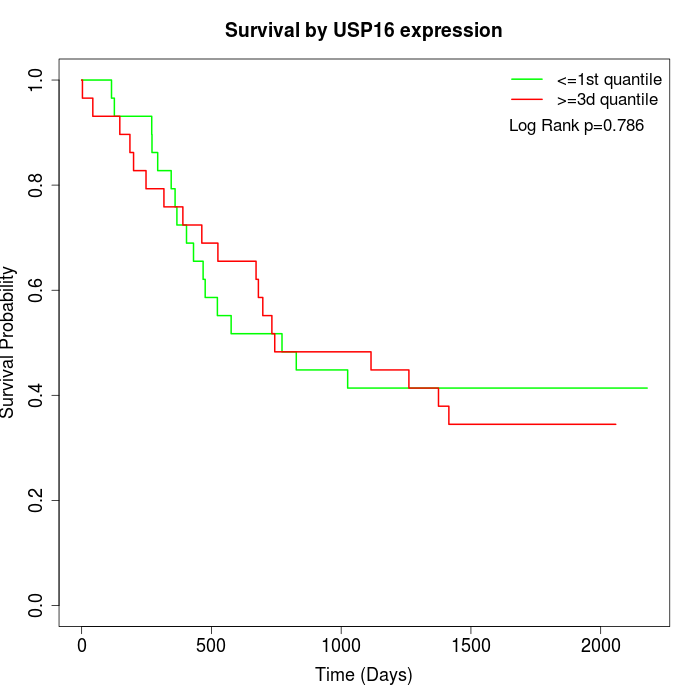 | 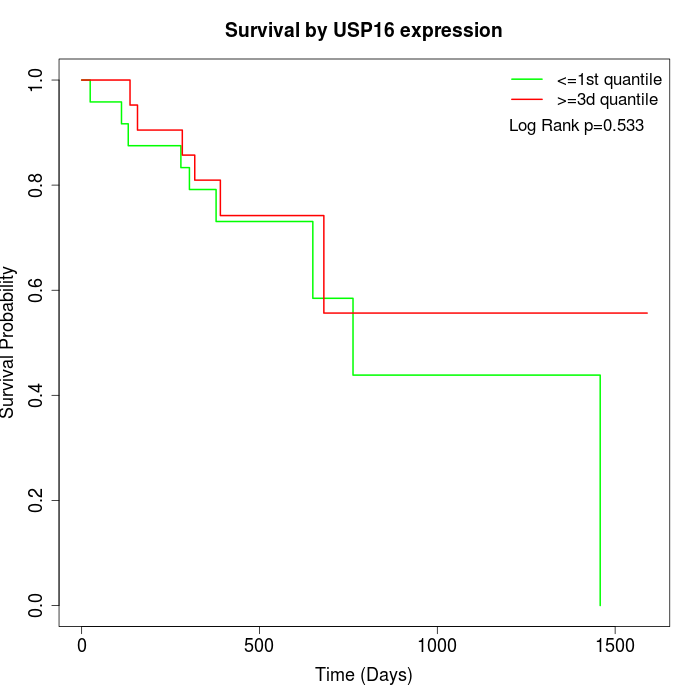 |
| GSE53622 | GSE53624 | TCGA |
Note: Click image to view full size file.
Copy number change of USP16:
| Dataset | Gene | EntrezID | Gain | Loss | Normal | Detail |
|---|---|---|---|---|---|---|
| GSE15526 | USP16 | 10600 | 2 | 10 | 18 | |
| GSE20123 | USP16 | 10600 | 2 | 10 | 18 | |
| GSE43470 | USP16 | 10600 | 1 | 8 | 34 | |
| GSE46452 | USP16 | 10600 | 1 | 21 | 37 | |
| GSE47630 | USP16 | 10600 | 6 | 17 | 17 | |
| GSE54993 | USP16 | 10600 | 9 | 1 | 60 | |
| GSE54994 | USP16 | 10600 | 1 | 9 | 43 | |
| GSE60625 | USP16 | 10600 | 0 | 0 | 11 | |
| GSE74703 | USP16 | 10600 | 1 | 6 | 29 | |
| GSE74704 | USP16 | 10600 | 2 | 6 | 12 | |
| TCGA | USP16 | 10600 | 9 | 37 | 50 |
Total number of gains: 34; Total number of losses: 125; Total Number of normals: 329.
Somatic mutations of USP16:
Generating mutation plots.
Highly correlated genes for USP16:
Showing top 20/1323 corelated genes with mean PCC>0.5.
| Gene1 | Gene2 | Mean PCC | Num. Datasets | Num. PCC<0 | Num. PCC>0.5 |
|---|---|---|---|---|---|
| USP16 | MTA3 | 0.817143 | 3 | 0 | 3 |
| USP16 | NDUFV3 | 0.770274 | 4 | 0 | 4 |
| USP16 | KCTD10 | 0.757942 | 3 | 0 | 3 |
| USP16 | ALG6 | 0.736961 | 3 | 0 | 3 |
| USP16 | PPP2R5E | 0.724259 | 4 | 0 | 4 |
| USP16 | CHD1 | 0.722907 | 3 | 0 | 3 |
| USP16 | PPP2R1B | 0.722667 | 3 | 0 | 3 |
| USP16 | NMT2 | 0.720259 | 3 | 0 | 3 |
| USP16 | AQR | 0.715373 | 3 | 0 | 3 |
| USP16 | FOXO3 | 0.714281 | 3 | 0 | 3 |
| USP16 | PITRM1 | 0.713281 | 3 | 0 | 3 |
| USP16 | WWP1 | 0.711064 | 4 | 0 | 3 |
| USP16 | MTOR | 0.709179 | 3 | 0 | 3 |
| USP16 | TP53INP2 | 0.706154 | 5 | 0 | 5 |
| USP16 | CNOT4 | 0.703815 | 4 | 0 | 3 |
| USP16 | CPEB4 | 0.702775 | 6 | 0 | 6 |
| USP16 | PEX2 | 0.702499 | 3 | 0 | 3 |
| USP16 | CNTNAP3 | 0.699904 | 4 | 0 | 4 |
| USP16 | OXNAD1 | 0.699414 | 6 | 0 | 6 |
| USP16 | WDFY1 | 0.698702 | 3 | 0 | 3 |
For details and further investigation, click here