| Full name: adaptor related protein complex 2 subunit mu 1 | Alias Symbol: AP50|mu2 | ||
| Type: protein-coding gene | Cytoband: 3q27.1 | ||
| Entrez ID: 1173 | HGNC ID: HGNC:564 | Ensembl Gene: ENSG00000161203 | OMIM ID: 601024 |
Screen Evidence:
| |||
AP2M1 involved pathways:
| KEGG pathway | Description | View |
|---|---|---|
| hsa05016 | Huntington's disease |
Expression of AP2M1:
| Dataset | Gene | EntrezID | Probe | Log2FC | Adj.pValue | Expression |
|---|---|---|---|---|---|---|
| GSE17351 | AP2M1 | 1173 | 200613_at | 0.6339 | 0.1621 | |
| GSE20347 | AP2M1 | 1173 | 200613_at | 0.7105 | 0.0000 | |
| GSE23400 | AP2M1 | 1173 | 200613_at | 0.6382 | 0.0000 | |
| GSE26886 | AP2M1 | 1173 | 200613_at | -0.9964 | 0.0003 | |
| GSE29001 | AP2M1 | 1173 | 200613_at | 0.5653 | 0.1898 | |
| GSE38129 | AP2M1 | 1173 | 200613_at | 0.6206 | 0.0000 | |
| GSE45670 | AP2M1 | 1173 | 200613_at | 0.4277 | 0.0360 | |
| GSE53622 | AP2M1 | 1173 | 49151 | 0.2639 | 0.0000 | |
| GSE53624 | AP2M1 | 1173 | 49151 | 0.7387 | 0.0000 | |
| GSE63941 | AP2M1 | 1173 | 200613_at | 1.9222 | 0.0018 | |
| GSE77861 | AP2M1 | 1173 | 200613_at | 0.4317 | 0.1540 | |
| GSE97050 | AP2M1 | 1173 | A_33_P3378800 | 0.4017 | 0.1482 | |
| SRP007169 | AP2M1 | 1173 | RNAseq | 0.8101 | 0.0504 | |
| SRP008496 | AP2M1 | 1173 | RNAseq | 0.5945 | 0.0294 | |
| SRP064894 | AP2M1 | 1173 | RNAseq | 0.9171 | 0.0000 | |
| SRP133303 | AP2M1 | 1173 | RNAseq | 1.0122 | 0.0000 | |
| SRP159526 | AP2M1 | 1173 | RNAseq | 1.0415 | 0.0000 | |
| SRP193095 | AP2M1 | 1173 | RNAseq | 0.7163 | 0.0000 | |
| SRP219564 | AP2M1 | 1173 | RNAseq | 0.2252 | 0.6277 | |
| TCGA | AP2M1 | 1173 | RNAseq | 0.2386 | 0.0000 |
Upregulated datasets: 3; Downregulated datasets: 0.
Survival by AP2M1 expression:
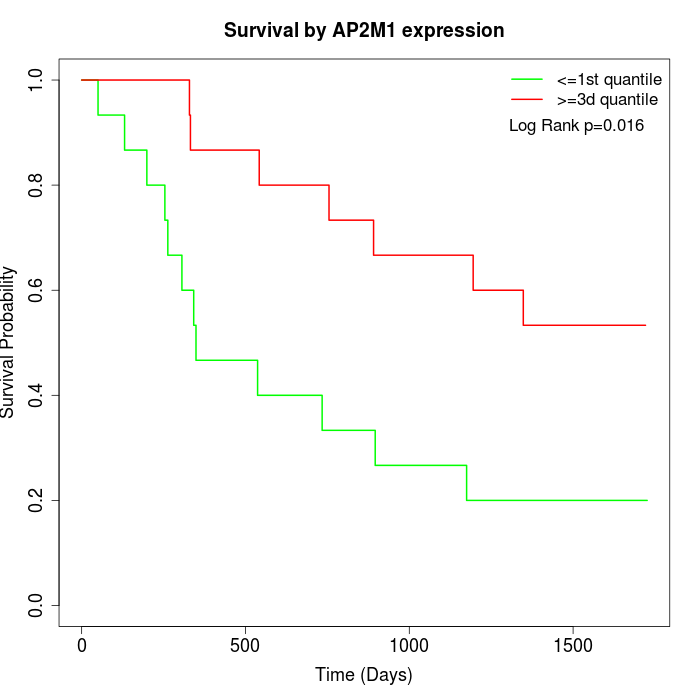 | 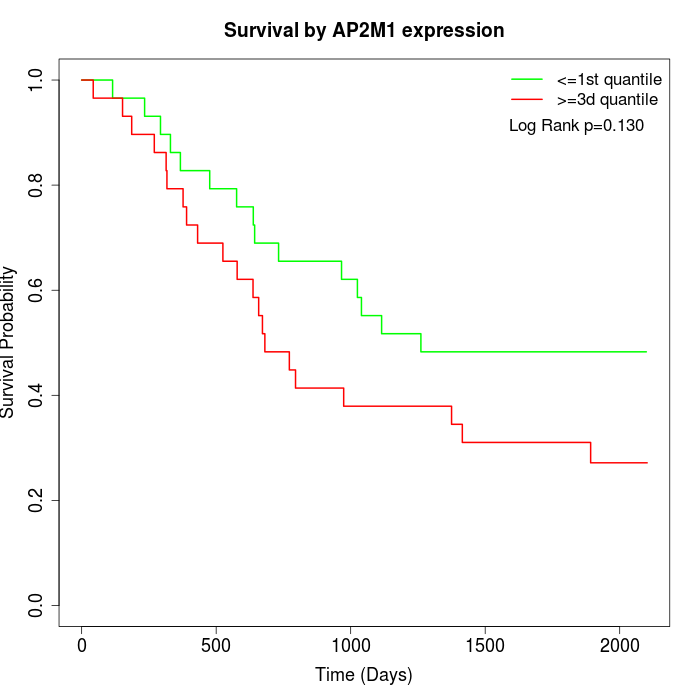 | 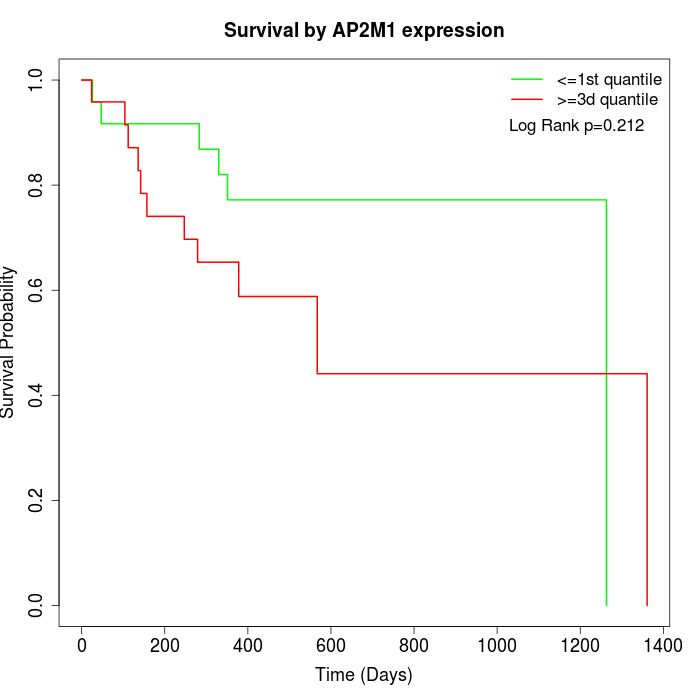 |
| GSE53622 | GSE53624 | TCGA |
Note: Click image to view full size file.
Copy number change of AP2M1:
| Dataset | Gene | EntrezID | Gain | Loss | Normal | Detail |
|---|---|---|---|---|---|---|
| GSE15526 | AP2M1 | 1173 | 25 | 0 | 5 | |
| GSE20123 | AP2M1 | 1173 | 25 | 0 | 5 | |
| GSE43470 | AP2M1 | 1173 | 25 | 0 | 18 | |
| GSE46452 | AP2M1 | 1173 | 19 | 1 | 39 | |
| GSE47630 | AP2M1 | 1173 | 27 | 2 | 11 | |
| GSE54993 | AP2M1 | 1173 | 1 | 19 | 50 | |
| GSE54994 | AP2M1 | 1173 | 41 | 0 | 12 | |
| GSE60625 | AP2M1 | 1173 | 0 | 6 | 5 | |
| GSE74703 | AP2M1 | 1173 | 21 | 0 | 15 | |
| GSE74704 | AP2M1 | 1173 | 17 | 0 | 3 | |
| TCGA | AP2M1 | 1173 | 77 | 0 | 19 |
Total number of gains: 278; Total number of losses: 28; Total Number of normals: 182.
Somatic mutations of AP2M1:
Generating mutation plots.
Highly correlated genes for AP2M1:
Showing top 20/920 corelated genes with mean PCC>0.5.
| Gene1 | Gene2 | Mean PCC | Num. Datasets | Num. PCC<0 | Num. PCC>0.5 |
|---|---|---|---|---|---|
| AP2M1 | MOB3C | 0.808785 | 3 | 0 | 3 |
| AP2M1 | NDUFS3 | 0.795555 | 3 | 0 | 3 |
| AP2M1 | PSMD2 | 0.792109 | 12 | 0 | 12 |
| AP2M1 | RNF7 | 0.778667 | 9 | 0 | 9 |
| AP2M1 | COMMD2 | 0.777992 | 5 | 0 | 5 |
| AP2M1 | DNAJC19 | 0.753102 | 5 | 0 | 5 |
| AP2M1 | RNF181 | 0.747036 | 3 | 0 | 3 |
| AP2M1 | MRPL38 | 0.746572 | 5 | 0 | 5 |
| AP2M1 | ARAP1 | 0.741935 | 3 | 0 | 3 |
| AP2M1 | NECAP1 | 0.736401 | 3 | 0 | 3 |
| AP2M1 | ALG3 | 0.734655 | 13 | 0 | 12 |
| AP2M1 | PARL | 0.728854 | 12 | 0 | 11 |
| AP2M1 | INTS10 | 0.725165 | 3 | 0 | 3 |
| AP2M1 | UQCR10 | 0.720216 | 3 | 0 | 3 |
| AP2M1 | PSPC1 | 0.719868 | 4 | 0 | 3 |
| AP2M1 | FBXW8 | 0.719357 | 4 | 0 | 3 |
| AP2M1 | TMEM41A | 0.716791 | 7 | 0 | 6 |
| AP2M1 | FAN1 | 0.713454 | 3 | 0 | 3 |
| AP2M1 | PRELID1 | 0.712694 | 4 | 0 | 4 |
| AP2M1 | PGAM5 | 0.71194 | 4 | 0 | 4 |
For details and further investigation, click here