| Full name: centromere protein M | Alias Symbol: Pane1|CENP-M|MGC861 | ||
| Type: protein-coding gene | Cytoband: 22q13.2 | ||
| Entrez ID: 79019 | HGNC ID: HGNC:18352 | Ensembl Gene: ENSG00000100162 | OMIM ID: 610152 |
Screen Evidence:
| |||
Expression of CENPM:
| Dataset | Gene | EntrezID | Probe | Log2FC | Adj.pValue | Expression |
|---|---|---|---|---|---|---|
| GSE17351 | CENPM | 79019 | 218741_at | 0.9664 | 0.0265 | |
| GSE20347 | CENPM | 79019 | 218741_at | 1.1108 | 0.0000 | |
| GSE23400 | CENPM | 79019 | 218741_at | 0.7001 | 0.0000 | |
| GSE26886 | CENPM | 79019 | 218741_at | 0.8436 | 0.0001 | |
| GSE29001 | CENPM | 79019 | 218741_at | 0.8524 | 0.0054 | |
| GSE38129 | CENPM | 79019 | 218741_at | 1.2618 | 0.0000 | |
| GSE45670 | CENPM | 79019 | 218741_at | 0.9509 | 0.0000 | |
| GSE53622 | CENPM | 79019 | 77080 | 1.3402 | 0.0000 | |
| GSE53624 | CENPM | 79019 | 77080 | 1.4215 | 0.0000 | |
| GSE63941 | CENPM | 79019 | 218741_at | 2.4436 | 0.0003 | |
| GSE77861 | CENPM | 79019 | 218741_at | 0.6465 | 0.0022 | |
| GSE97050 | CENPM | 79019 | A_24_P399888 | 1.1912 | 0.1388 | |
| SRP007169 | CENPM | 79019 | RNAseq | 1.0152 | 0.0354 | |
| SRP064894 | CENPM | 79019 | RNAseq | 1.4920 | 0.0000 | |
| SRP133303 | CENPM | 79019 | RNAseq | 0.5292 | 0.0035 | |
| SRP159526 | CENPM | 79019 | RNAseq | 1.2331 | 0.0000 | |
| SRP193095 | CENPM | 79019 | RNAseq | 0.5235 | 0.0000 | |
| SRP219564 | CENPM | 79019 | RNAseq | 1.4352 | 0.0255 | |
| TCGA | CENPM | 79019 | RNAseq | 1.2900 | 0.0000 |
Upregulated datasets: 10; Downregulated datasets: 0.
Survival by CENPM expression:
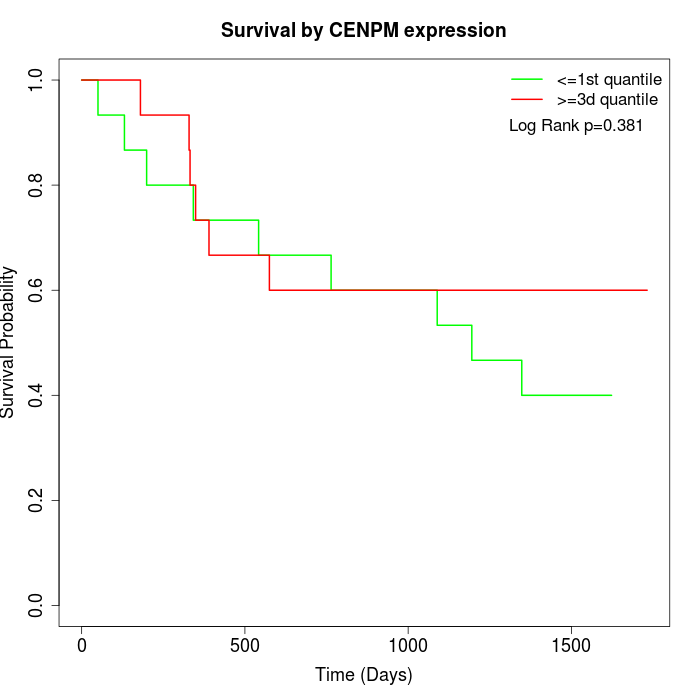 | 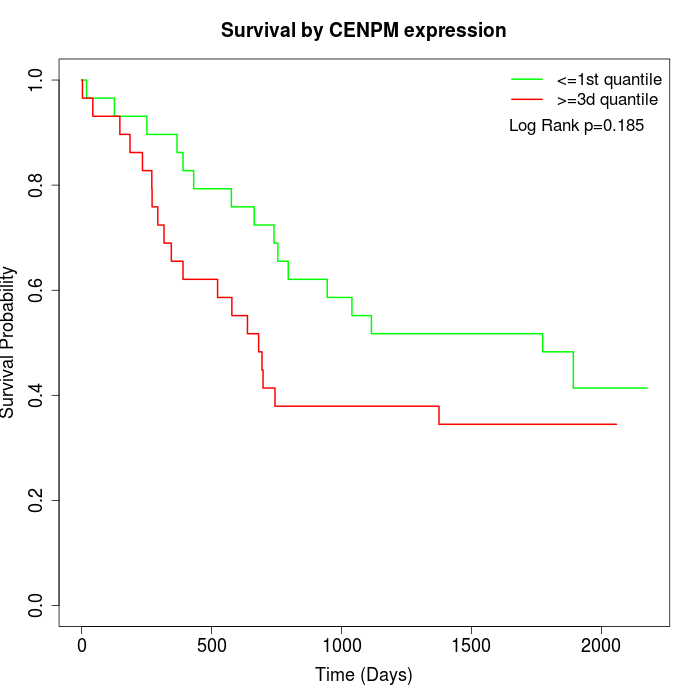 | 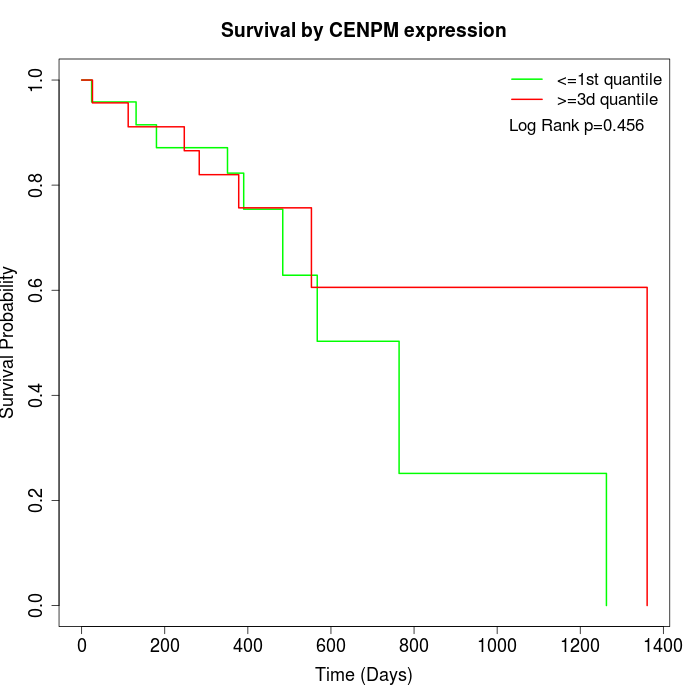 |
| GSE53622 | GSE53624 | TCGA |
Note: Click image to view full size file.
Copy number change of CENPM:
| Dataset | Gene | EntrezID | Gain | Loss | Normal | Detail |
|---|---|---|---|---|---|---|
| GSE15526 | CENPM | 79019 | 6 | 5 | 19 | |
| GSE20123 | CENPM | 79019 | 6 | 4 | 20 | |
| GSE43470 | CENPM | 79019 | 5 | 6 | 32 | |
| GSE46452 | CENPM | 79019 | 31 | 2 | 26 | |
| GSE47630 | CENPM | 79019 | 9 | 4 | 27 | |
| GSE54993 | CENPM | 79019 | 3 | 6 | 61 | |
| GSE54994 | CENPM | 79019 | 11 | 8 | 34 | |
| GSE60625 | CENPM | 79019 | 5 | 0 | 6 | |
| GSE74703 | CENPM | 79019 | 5 | 4 | 27 | |
| GSE74704 | CENPM | 79019 | 3 | 2 | 15 | |
| TCGA | CENPM | 79019 | 27 | 14 | 55 |
Total number of gains: 111; Total number of losses: 55; Total Number of normals: 322.
Somatic mutations of CENPM:
Generating mutation plots.
Highly correlated genes for CENPM:
Showing top 20/1920 corelated genes with mean PCC>0.5.
| Gene1 | Gene2 | Mean PCC | Num. Datasets | Num. PCC<0 | Num. PCC>0.5 |
|---|---|---|---|---|---|
| CENPM | CDC45 | 0.827014 | 12 | 0 | 12 |
| CENPM | GINS2 | 0.806055 | 12 | 0 | 12 |
| CENPM | CCNB2 | 0.80204 | 12 | 0 | 12 |
| CENPM | MCM2 | 0.797586 | 12 | 0 | 12 |
| CENPM | NCAPH | 0.795024 | 9 | 0 | 9 |
| CENPM | UBE2C | 0.794727 | 13 | 0 | 13 |
| CENPM | SPAG5 | 0.793093 | 13 | 0 | 12 |
| CENPM | GINS1 | 0.791541 | 12 | 0 | 12 |
| CENPM | MYBL2 | 0.786676 | 12 | 0 | 12 |
| CENPM | TOP2A | 0.783954 | 13 | 0 | 13 |
| CENPM | UBE2T | 0.782622 | 9 | 0 | 9 |
| CENPM | BIRC5 | 0.781624 | 13 | 0 | 12 |
| CENPM | TRIP13 | 0.781309 | 12 | 0 | 12 |
| CENPM | KNSTRN | 0.777971 | 7 | 0 | 7 |
| CENPM | MCM5 | 0.776523 | 12 | 0 | 10 |
| CENPM | BLM | 0.776286 | 13 | 0 | 13 |
| CENPM | CDCA3 | 0.775768 | 13 | 0 | 12 |
| CENPM | NUSAP1 | 0.77509 | 13 | 0 | 12 |
| CENPM | DTL | 0.773778 | 13 | 0 | 13 |
| CENPM | CENPF | 0.771073 | 13 | 0 | 13 |
For details and further investigation, click here