| Full name: centrosomal protein 78 | Alias Symbol: FLJ12643 | ||
| Type: protein-coding gene | Cytoband: 9q21.2 | ||
| Entrez ID: 84131 | HGNC ID: HGNC:25740 | Ensembl Gene: ENSG00000148019 | OMIM ID: 617110 |
Expression of CEP78:
| Dataset | Gene | EntrezID | Probe | Log2FC | Adj.pValue | Expression |
|---|---|---|---|---|---|---|
| GSE17351 | CEP78 | 84131 | 228774_at | 0.3779 | 0.1720 | |
| GSE26886 | CEP78 | 84131 | 228774_at | 0.8420 | 0.0003 | |
| GSE45670 | CEP78 | 84131 | 228774_at | 0.6751 | 0.0007 | |
| GSE53622 | CEP78 | 84131 | 32799 | 0.5788 | 0.0000 | |
| GSE53624 | CEP78 | 84131 | 32799 | 0.9706 | 0.0000 | |
| GSE63941 | CEP78 | 84131 | 228774_at | 1.0729 | 0.0809 | |
| GSE77861 | CEP78 | 84131 | 228774_at | 0.7325 | 0.0101 | |
| GSE97050 | CEP78 | 84131 | A_33_P3219641 | 0.2856 | 0.4201 | |
| SRP007169 | CEP78 | 84131 | RNAseq | 2.5601 | 0.0000 | |
| SRP008496 | CEP78 | 84131 | RNAseq | 2.3057 | 0.0000 | |
| SRP064894 | CEP78 | 84131 | RNAseq | 0.8635 | 0.0000 | |
| SRP133303 | CEP78 | 84131 | RNAseq | 0.5914 | 0.0000 | |
| SRP159526 | CEP78 | 84131 | RNAseq | 0.6988 | 0.0196 | |
| SRP193095 | CEP78 | 84131 | RNAseq | 0.4396 | 0.0001 | |
| SRP219564 | CEP78 | 84131 | RNAseq | 0.5640 | 0.0381 | |
| TCGA | CEP78 | 84131 | RNAseq | 0.2400 | 0.0006 |
Upregulated datasets: 2; Downregulated datasets: 0.
Survival by CEP78 expression:
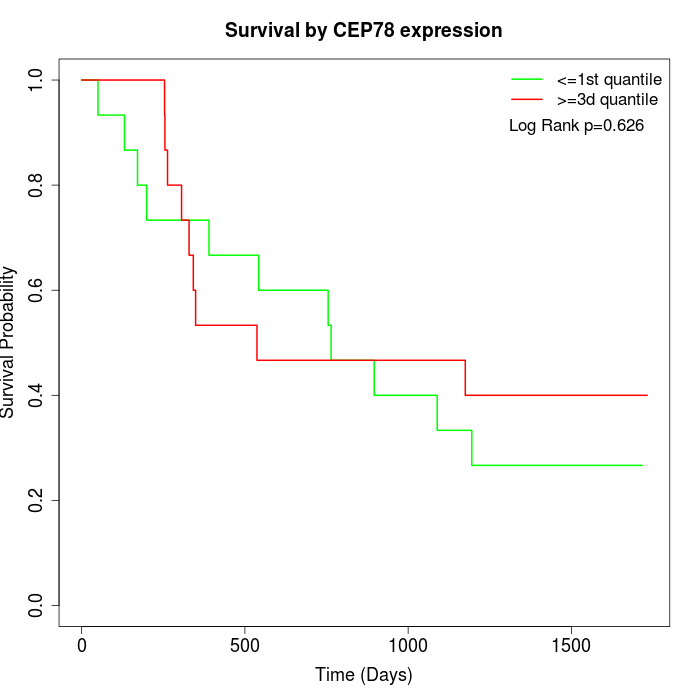 | 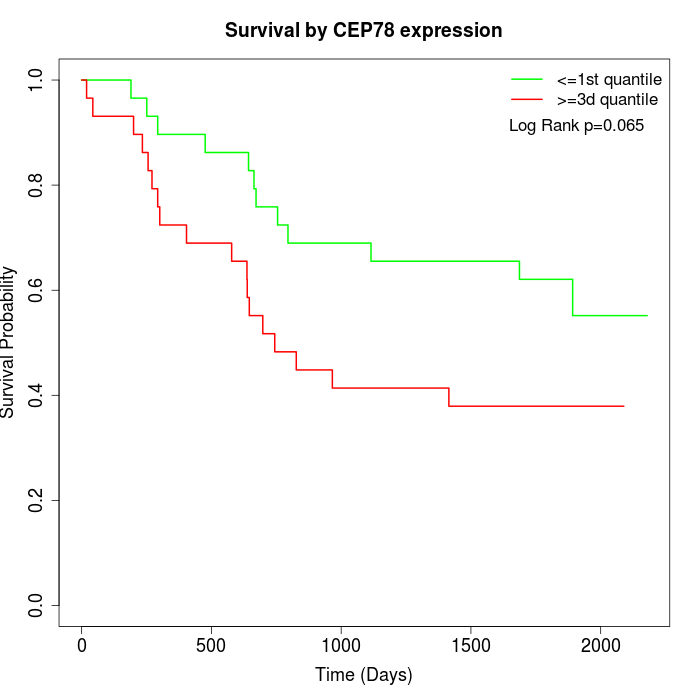 | 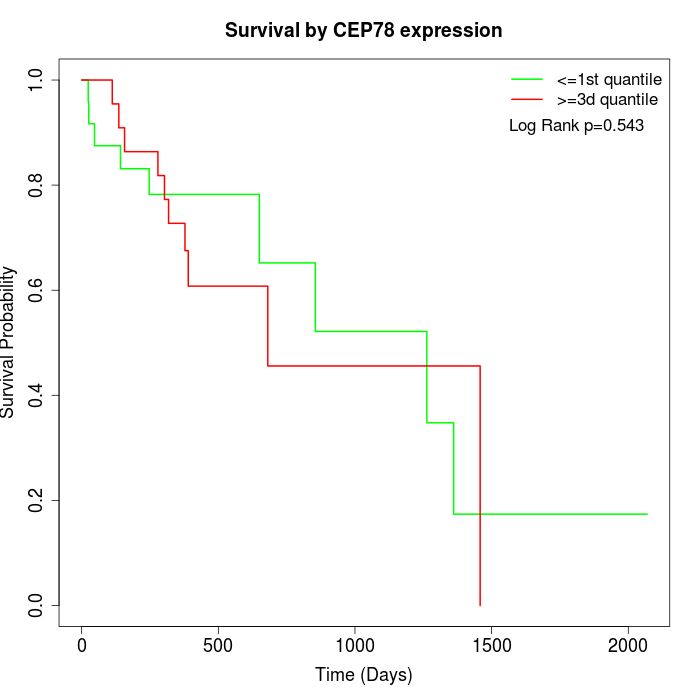 |
| GSE53622 | GSE53624 | TCGA |
Note: Click image to view full size file.
Copy number change of CEP78:
| Dataset | Gene | EntrezID | Gain | Loss | Normal | Detail |
|---|---|---|---|---|---|---|
| GSE15526 | CEP78 | 84131 | 5 | 10 | 15 | |
| GSE20123 | CEP78 | 84131 | 5 | 10 | 15 | |
| GSE43470 | CEP78 | 84131 | 6 | 5 | 32 | |
| GSE46452 | CEP78 | 84131 | 6 | 14 | 39 | |
| GSE47630 | CEP78 | 84131 | 1 | 18 | 21 | |
| GSE54993 | CEP78 | 84131 | 4 | 2 | 64 | |
| GSE54994 | CEP78 | 84131 | 4 | 12 | 37 | |
| GSE60625 | CEP78 | 84131 | 0 | 0 | 11 | |
| GSE74703 | CEP78 | 84131 | 5 | 4 | 27 | |
| GSE74704 | CEP78 | 84131 | 3 | 7 | 10 | |
| TCGA | CEP78 | 84131 | 19 | 28 | 49 |
Total number of gains: 58; Total number of losses: 110; Total Number of normals: 320.
Somatic mutations of CEP78:
Generating mutation plots.
Highly correlated genes for CEP78:
Showing top 20/1614 corelated genes with mean PCC>0.5.
| Gene1 | Gene2 | Mean PCC | Num. Datasets | Num. PCC<0 | Num. PCC>0.5 |
|---|---|---|---|---|---|
| CEP78 | CD276 | 0.779278 | 4 | 0 | 4 |
| CEP78 | FHL3 | 0.766462 | 3 | 0 | 3 |
| CEP78 | CRISPLD2 | 0.749782 | 3 | 0 | 3 |
| CEP78 | MCM6 | 0.742347 | 9 | 0 | 9 |
| CEP78 | SOAT1 | 0.737555 | 5 | 0 | 5 |
| CEP78 | MMS22L | 0.735433 | 3 | 0 | 3 |
| CEP78 | POLA2 | 0.72906 | 7 | 0 | 6 |
| CEP78 | USP39 | 0.720124 | 6 | 0 | 6 |
| CEP78 | BRCA1 | 0.716594 | 8 | 0 | 8 |
| CEP78 | SLC16A1 | 0.708156 | 5 | 0 | 5 |
| CEP78 | A4GALT | 0.706874 | 3 | 0 | 3 |
| CEP78 | TTL | 0.703752 | 7 | 0 | 6 |
| CEP78 | COLGALT1 | 0.702706 | 6 | 0 | 6 |
| CEP78 | SNAP47 | 0.702645 | 3 | 0 | 3 |
| CEP78 | BLM | 0.699883 | 9 | 0 | 8 |
| CEP78 | XPO1 | 0.69782 | 7 | 0 | 6 |
| CEP78 | CKS2 | 0.695133 | 8 | 0 | 8 |
| CEP78 | ATP13A3 | 0.694927 | 7 | 0 | 7 |
| CEP78 | AFAP1L2 | 0.692112 | 3 | 0 | 3 |
| CEP78 | ST20 | 0.692037 | 5 | 0 | 5 |
For details and further investigation, click here