| Full name: CTP synthase 1 | Alias Symbol: GATD5 | ||
| Type: protein-coding gene | Cytoband: 1p34.2 | ||
| Entrez ID: 1503 | HGNC ID: HGNC:2519 | Ensembl Gene: ENSG00000171793 | OMIM ID: 123860 |
Screen Evidence:
| |||
Expression of CTPS1:
| Dataset | Gene | EntrezID | Probe | Log2FC | Adj.pValue | Expression |
|---|---|---|---|---|---|---|
| GSE17351 | CTPS1 | 1503 | 202613_at | 0.8375 | 0.1538 | |
| GSE20347 | CTPS1 | 1503 | 202613_at | 0.9265 | 0.0013 | |
| GSE23400 | CTPS1 | 1503 | 202613_at | 0.8288 | 0.0000 | |
| GSE26886 | CTPS1 | 1503 | 202613_at | 0.5052 | 0.0389 | |
| GSE29001 | CTPS1 | 1503 | 202613_at | 0.8128 | 0.0062 | |
| GSE38129 | CTPS1 | 1503 | 202613_at | 1.0410 | 0.0000 | |
| GSE45670 | CTPS1 | 1503 | 202613_at | 0.7471 | 0.0019 | |
| GSE53622 | CTPS1 | 1503 | 34530 | 0.6996 | 0.0000 | |
| GSE53624 | CTPS1 | 1503 | 34530 | 1.0950 | 0.0000 | |
| GSE63941 | CTPS1 | 1503 | 202613_at | -0.2367 | 0.7687 | |
| GSE77861 | CTPS1 | 1503 | 202613_at | 0.7413 | 0.0165 | |
| SRP007169 | CTPS1 | 1503 | RNAseq | 1.4992 | 0.0024 | |
| SRP008496 | CTPS1 | 1503 | RNAseq | 1.3503 | 0.0000 | |
| SRP064894 | CTPS1 | 1503 | RNAseq | 0.8579 | 0.0000 | |
| SRP133303 | CTPS1 | 1503 | RNAseq | 0.9888 | 0.0001 | |
| SRP159526 | CTPS1 | 1503 | RNAseq | 1.2970 | 0.0221 | |
| SRP193095 | CTPS1 | 1503 | RNAseq | 0.8364 | 0.0000 | |
| SRP219564 | CTPS1 | 1503 | RNAseq | 0.6614 | 0.2318 |
Upregulated datasets: 5; Downregulated datasets: 0.
Survival by CTPS1 expression:
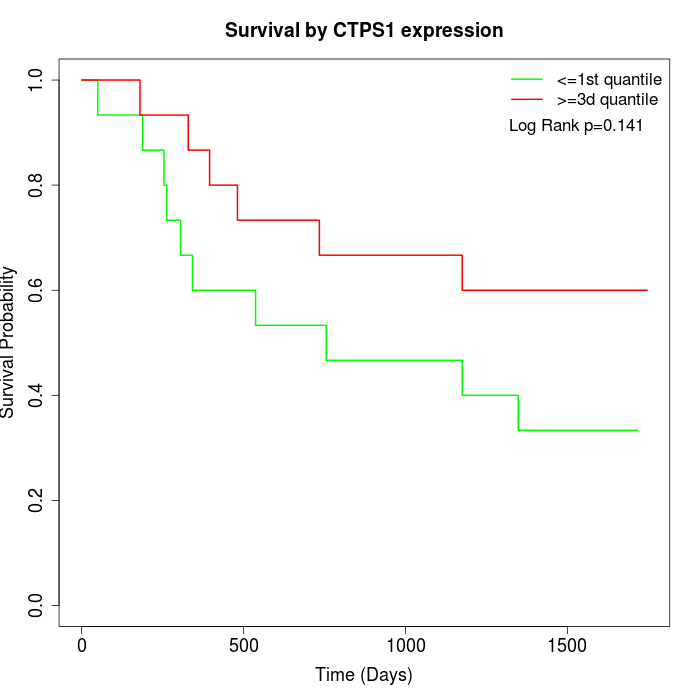 | 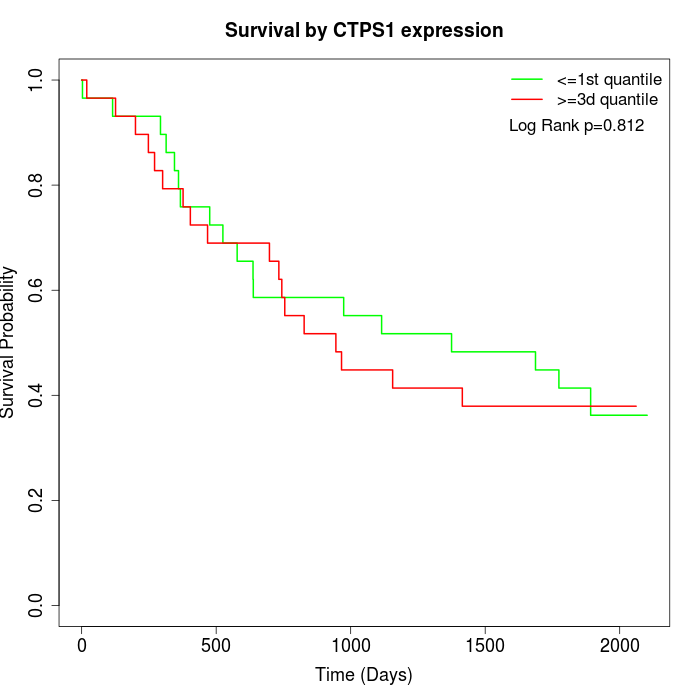 |
| GSE53622 | GSE53624 |
Note: Click image to view full size file.
Copy number change of CTPS1:
| Dataset | Gene | EntrezID | Gain | Loss | Normal | Detail |
|---|---|---|---|---|---|---|
| GSE15526 | CTPS1 | 1503 | 3 | 4 | 23 | |
| GSE20123 | CTPS1 | 1503 | 2 | 3 | 25 | |
| GSE43470 | CTPS1 | 1503 | 7 | 2 | 34 | |
| GSE46452 | CTPS1 | 1503 | 3 | 1 | 55 | |
| GSE47630 | CTPS1 | 1503 | 9 | 2 | 29 | |
| GSE54993 | CTPS1 | 1503 | 0 | 1 | 69 | |
| GSE54994 | CTPS1 | 1503 | 13 | 2 | 38 | |
| GSE60625 | CTPS1 | 1503 | 0 | 0 | 11 | |
| GSE74703 | CTPS1 | 1503 | 6 | 1 | 29 | |
| GSE74704 | CTPS1 | 1503 | 1 | 0 | 19 | |
| TCGA | CTPS1 | 1503 | 16 | 16 | 64 |
Total number of gains: 60; Total number of losses: 32; Total Number of normals: 396.
Somatic mutations of CTPS1:
Generating mutation plots.
Highly correlated genes for CTPS1:
Showing top 20/1507 corelated genes with mean PCC>0.5.
| Gene1 | Gene2 | Mean PCC | Num. Datasets | Num. PCC<0 | Num. PCC>0.5 |
|---|---|---|---|---|---|
| CTPS1 | CDC20 | 0.749019 | 9 | 0 | 9 |
| CTPS1 | RUVBL1 | 0.729982 | 10 | 0 | 10 |
| CTPS1 | TIGD1 | 0.729657 | 3 | 0 | 3 |
| CTPS1 | RNASEH2A | 0.725463 | 9 | 0 | 9 |
| CTPS1 | NDC1 | 0.717026 | 9 | 0 | 8 |
| CTPS1 | KIF2C | 0.712998 | 9 | 0 | 9 |
| CTPS1 | TPX2 | 0.710935 | 9 | 0 | 9 |
| CTPS1 | UHRF1 | 0.707716 | 5 | 0 | 5 |
| CTPS1 | CDCA3 | 0.702878 | 9 | 0 | 9 |
| CTPS1 | RRP15 | 0.702007 | 10 | 0 | 10 |
| CTPS1 | EEF1E1 | 0.700503 | 7 | 0 | 7 |
| CTPS1 | PPIL1 | 0.699574 | 5 | 0 | 5 |
| CTPS1 | CDCA8 | 0.697832 | 9 | 0 | 9 |
| CTPS1 | TTC4 | 0.697623 | 11 | 0 | 11 |
| CTPS1 | UBE2S | 0.696242 | 6 | 0 | 6 |
| CTPS1 | CPSF6 | 0.695925 | 10 | 0 | 9 |
| CTPS1 | ERI3 | 0.69583 | 8 | 0 | 8 |
| CTPS1 | CDC6 | 0.695149 | 7 | 0 | 7 |
| CTPS1 | CKS1B | 0.694828 | 10 | 0 | 10 |
| CTPS1 | WDR54 | 0.693535 | 4 | 0 | 4 |
For details and further investigation, click here