| Full name: cathepsin C | Alias Symbol: DPP1 | ||
| Type: protein-coding gene | Cytoband: 11q14.2 | ||
| Entrez ID: 1075 | HGNC ID: HGNC:2528 | Ensembl Gene: ENSG00000109861 | OMIM ID: 602365 |
| Related drugs: CALCIUM GLUCONATE, PENTOSAN POLYSULFATE SODIUM, PROGESTERONE, YOHIMBINE... [more] | |||
CTSC involved pathways:
| KEGG pathway | Description | View |
|---|---|---|
| hsa04210 | Apoptosis |
Expression of CTSC:
| Dataset | Gene | EntrezID | Probe | Log2FC | Adj.pValue | Expression |
|---|---|---|---|---|---|---|
| GSE17351 | CTSC | 1075 | 201487_at | 0.8402 | 0.2733 | |
| GSE20347 | CTSC | 1075 | 201487_at | 0.9189 | 0.0201 | |
| GSE23400 | CTSC | 1075 | 201487_at | 1.3706 | 0.0000 | |
| GSE26886 | CTSC | 1075 | 201487_at | 1.1074 | 0.0011 | |
| GSE29001 | CTSC | 1075 | 201487_at | 0.9096 | 0.0421 | |
| GSE38129 | CTSC | 1075 | 201487_at | 1.2343 | 0.0000 | |
| GSE45670 | CTSC | 1075 | 201487_at | 1.3237 | 0.0000 | |
| GSE53622 | CTSC | 1075 | 54220 | 1.5257 | 0.0000 | |
| GSE53624 | CTSC | 1075 | 54220 | 1.4649 | 0.0000 | |
| GSE63941 | CTSC | 1075 | 225647_s_at | -0.9712 | 0.2981 | |
| GSE77861 | CTSC | 1075 | 201487_at | 1.2456 | 0.0165 | |
| GSE97050 | CTSC | 1075 | A_23_P1552 | 1.8581 | 0.0762 | |
| SRP007169 | CTSC | 1075 | RNAseq | 2.6491 | 0.0000 | |
| SRP008496 | CTSC | 1075 | RNAseq | 2.4429 | 0.0000 | |
| SRP064894 | CTSC | 1075 | RNAseq | 1.5781 | 0.0000 | |
| SRP133303 | CTSC | 1075 | RNAseq | 1.3069 | 0.0000 | |
| SRP159526 | CTSC | 1075 | RNAseq | 1.8770 | 0.0074 | |
| SRP193095 | CTSC | 1075 | RNAseq | 1.0579 | 0.0000 | |
| SRP219564 | CTSC | 1075 | RNAseq | 2.3683 | 0.0002 | |
| TCGA | CTSC | 1075 | RNAseq | 0.4771 | 0.0000 |
Upregulated datasets: 14; Downregulated datasets: 0.
Survival by CTSC expression:
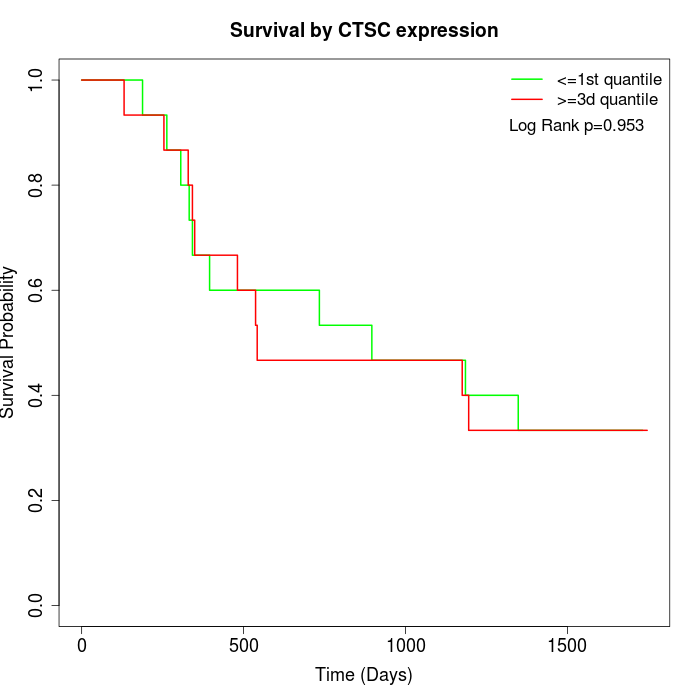 | 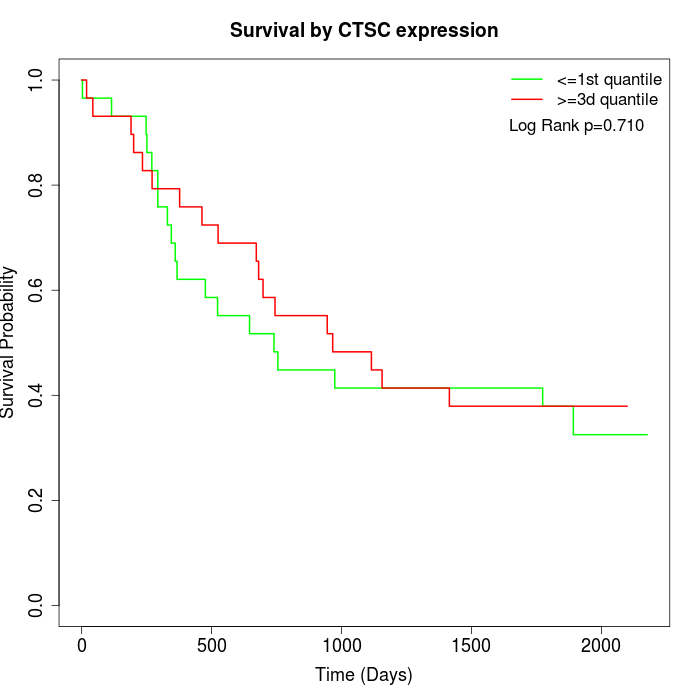 | 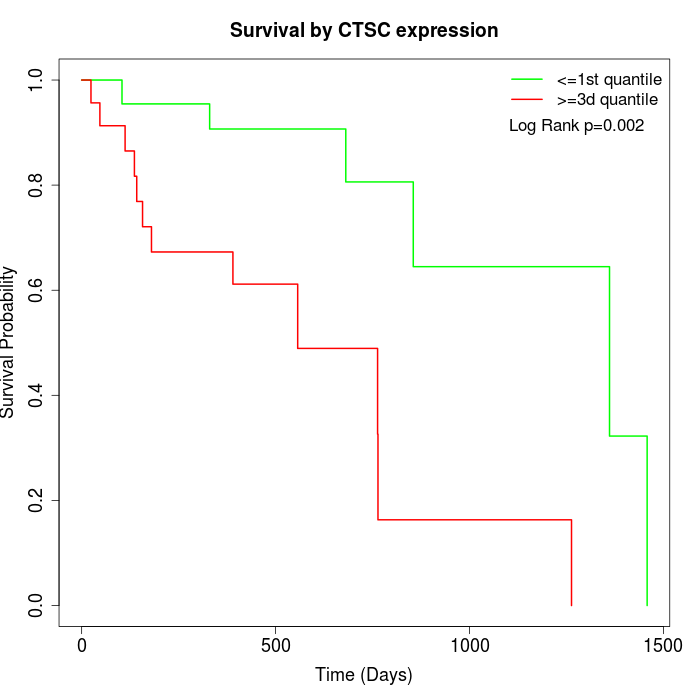 |
| GSE53622 | GSE53624 | TCGA |
Note: Click image to view full size file.
Copy number change of CTSC:
| Dataset | Gene | EntrezID | Gain | Loss | Normal | Detail |
|---|---|---|---|---|---|---|
| GSE15526 | CTSC | 1075 | 3 | 10 | 17 | |
| GSE20123 | CTSC | 1075 | 3 | 10 | 17 | |
| GSE43470 | CTSC | 1075 | 3 | 4 | 36 | |
| GSE46452 | CTSC | 1075 | 6 | 23 | 30 | |
| GSE47630 | CTSC | 1075 | 2 | 19 | 19 | |
| GSE54993 | CTSC | 1075 | 8 | 2 | 60 | |
| GSE54994 | CTSC | 1075 | 5 | 19 | 29 | |
| GSE60625 | CTSC | 1075 | 0 | 4 | 7 | |
| GSE74703 | CTSC | 1075 | 2 | 3 | 31 | |
| GSE74704 | CTSC | 1075 | 3 | 6 | 11 | |
| TCGA | CTSC | 1075 | 15 | 38 | 43 |
Total number of gains: 50; Total number of losses: 138; Total Number of normals: 300.
Somatic mutations of CTSC:
Generating mutation plots.
Highly correlated genes for CTSC:
Showing top 20/1148 corelated genes with mean PCC>0.5.
| Gene1 | Gene2 | Mean PCC | Num. Datasets | Num. PCC<0 | Num. PCC>0.5 |
|---|---|---|---|---|---|
| CTSC | DCBLD1 | 0.766498 | 7 | 0 | 7 |
| CTSC | FANCD2 | 0.70611 | 4 | 0 | 3 |
| CTSC | ADAMTS2 | 0.698308 | 5 | 0 | 4 |
| CTSC | EME1 | 0.696188 | 5 | 0 | 5 |
| CTSC | TPM3 | 0.695539 | 6 | 0 | 6 |
| CTSC | XPO5 | 0.691003 | 7 | 0 | 7 |
| CTSC | MMP12 | 0.685866 | 11 | 0 | 11 |
| CTSC | ZNF469 | 0.684919 | 6 | 0 | 6 |
| CTSC | SPRR2G | 0.684656 | 3 | 0 | 3 |
| CTSC | WDR66 | 0.68097 | 7 | 0 | 7 |
| CTSC | NOP56 | 0.675889 | 3 | 0 | 3 |
| CTSC | LRRC57 | 0.672607 | 3 | 0 | 3 |
| CTSC | KIF14 | 0.672571 | 11 | 0 | 10 |
| CTSC | MELK | 0.671525 | 10 | 0 | 10 |
| CTSC | MTFR2 | 0.670126 | 6 | 0 | 6 |
| CTSC | CDCA5 | 0.669543 | 6 | 0 | 6 |
| CTSC | FAM89A | 0.666535 | 3 | 0 | 3 |
| CTSC | NUF2 | 0.665448 | 7 | 0 | 7 |
| CTSC | FANCI | 0.664751 | 10 | 0 | 9 |
| CTSC | UHRF1 | 0.663688 | 7 | 0 | 7 |
For details and further investigation, click here