| Full name: cathepsin S | Alias Symbol: | ||
| Type: protein-coding gene | Cytoband: 1q21.3 | ||
| Entrez ID: 1520 | HGNC ID: HGNC:2545 | Ensembl Gene: ENSG00000163131 | OMIM ID: 116845 |
| Related drugs: CHEMBL2153161, CHEMBL222649, ODANACATIB... [more] | |||
CTSS involved pathways:
| KEGG pathway | Description | View |
|---|---|---|
| hsa04210 | Apoptosis | |
| hsa04612 | Antigen processing and presentation | |
| hsa05152 | Tuberculosis |
Expression of CTSS:
| Dataset | Gene | EntrezID | Probe | Log2FC | Adj.pValue | Expression |
|---|---|---|---|---|---|---|
| GSE17351 | CTSS | 1520 | 202902_s_at | -0.2991 | 0.8516 | |
| GSE20347 | CTSS | 1520 | 202902_s_at | -0.6377 | 0.0297 | |
| GSE23400 | CTSS | 1520 | 202902_s_at | 0.1512 | 0.2600 | |
| GSE26886 | CTSS | 1520 | 232617_at | -0.6464 | 0.0870 | |
| GSE29001 | CTSS | 1520 | 202902_s_at | -0.2734 | 0.3953 | |
| GSE38129 | CTSS | 1520 | 202902_s_at | -0.2698 | 0.4205 | |
| GSE45670 | CTSS | 1520 | 232617_at | -0.4236 | 0.1572 | |
| GSE53622 | CTSS | 1520 | 142009 | 0.2297 | 0.1034 | |
| GSE53624 | CTSS | 1520 | 142009 | 0.0914 | 0.5354 | |
| GSE63941 | CTSS | 1520 | 202902_s_at | 0.6810 | 0.6939 | |
| GSE77861 | CTSS | 1520 | 232617_at | -0.3430 | 0.0861 | |
| GSE97050 | CTSS | 1520 | A_24_P242646 | 0.5860 | 0.1314 | |
| SRP007169 | CTSS | 1520 | RNAseq | 0.9821 | 0.1707 | |
| SRP008496 | CTSS | 1520 | RNAseq | -0.4029 | 0.0287 | |
| SRP064894 | CTSS | 1520 | RNAseq | 1.0808 | 0.0028 | |
| SRP133303 | CTSS | 1520 | RNAseq | 0.4218 | 0.0812 | |
| SRP159526 | CTSS | 1520 | RNAseq | 0.0895 | 0.9128 | |
| SRP193095 | CTSS | 1520 | RNAseq | -0.2786 | 0.2975 | |
| SRP219564 | CTSS | 1520 | RNAseq | 1.0283 | 0.0298 | |
| TCGA | CTSS | 1520 | RNAseq | -0.1422 | 0.1642 |
Upregulated datasets: 2; Downregulated datasets: 0.
Survival by CTSS expression:
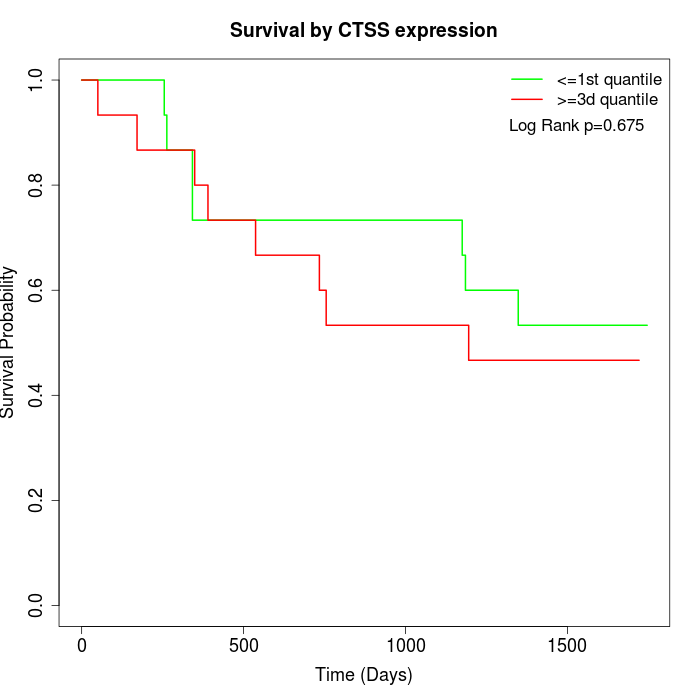 | 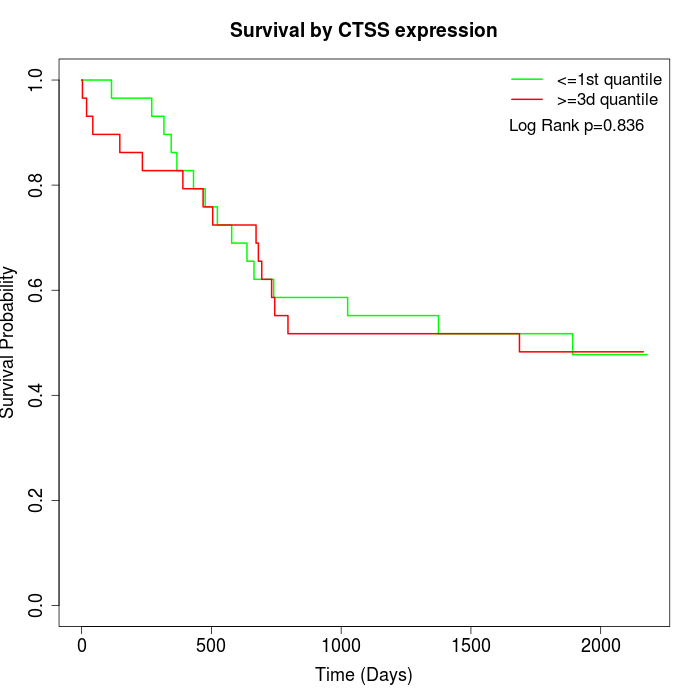 | 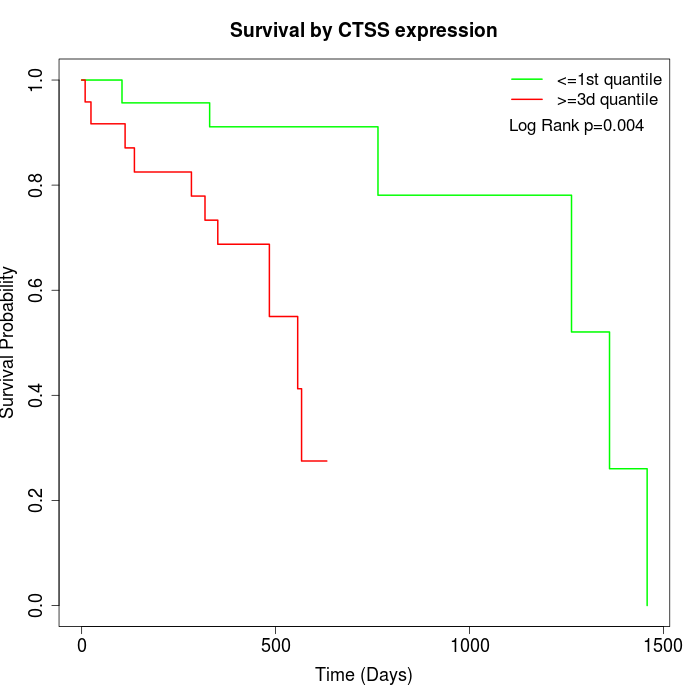 |
| GSE53622 | GSE53624 | TCGA |
Note: Click image to view full size file.
Copy number change of CTSS:
| Dataset | Gene | EntrezID | Gain | Loss | Normal | Detail |
|---|---|---|---|---|---|---|
| GSE15526 | CTSS | 1520 | 15 | 0 | 15 | |
| GSE20123 | CTSS | 1520 | 15 | 0 | 15 | |
| GSE43470 | CTSS | 1520 | 6 | 1 | 36 | |
| GSE46452 | CTSS | 1520 | 2 | 1 | 56 | |
| GSE47630 | CTSS | 1520 | 14 | 0 | 26 | |
| GSE54993 | CTSS | 1520 | 0 | 3 | 67 | |
| GSE54994 | CTSS | 1520 | 15 | 0 | 38 | |
| GSE60625 | CTSS | 1520 | 0 | 0 | 11 | |
| GSE74703 | CTSS | 1520 | 6 | 1 | 29 | |
| GSE74704 | CTSS | 1520 | 7 | 0 | 13 | |
| TCGA | CTSS | 1520 | 38 | 2 | 56 |
Total number of gains: 118; Total number of losses: 8; Total Number of normals: 362.
Somatic mutations of CTSS:
Generating mutation plots.
Highly correlated genes for CTSS:
Showing top 20/493 corelated genes with mean PCC>0.5.
| Gene1 | Gene2 | Mean PCC | Num. Datasets | Num. PCC<0 | Num. PCC>0.5 |
|---|---|---|---|---|---|
| CTSS | MPEG1 | 0.79013 | 5 | 0 | 5 |
| CTSS | C3orf80 | 0.740682 | 3 | 0 | 3 |
| CTSS | SGMS2 | 0.733879 | 3 | 0 | 3 |
| CTSS | PIK3R5 | 0.728397 | 5 | 0 | 4 |
| CTSS | TNFAIP8L2 | 0.720011 | 5 | 0 | 4 |
| CTSS | EVI2A | 0.718272 | 9 | 0 | 9 |
| CTSS | ITGB2 | 0.715066 | 10 | 0 | 9 |
| CTSS | HLA-DMB | 0.705978 | 10 | 0 | 8 |
| CTSS | GNG2 | 0.701598 | 3 | 0 | 3 |
| CTSS | RCSD1 | 0.701487 | 6 | 0 | 6 |
| CTSS | RGS18 | 0.701257 | 6 | 0 | 6 |
| CTSS | EVI2B | 0.701096 | 11 | 0 | 10 |
| CTSS | CD79B | 0.696995 | 3 | 0 | 3 |
| CTSS | NCKAP1L | 0.694403 | 8 | 0 | 7 |
| CTSS | HFE | 0.693422 | 3 | 0 | 3 |
| CTSS | ALOX5 | 0.691793 | 10 | 0 | 9 |
| CTSS | DOCK2 | 0.691457 | 10 | 0 | 9 |
| CTSS | LAPTM5 | 0.691308 | 11 | 0 | 9 |
| CTSS | CD53 | 0.690286 | 10 | 0 | 8 |
| CTSS | ITGAM | 0.688137 | 6 | 0 | 5 |
For details and further investigation, click here