| Full name: deltex E3 ubiquitin ligase 1 | Alias Symbol: hDx-1|RNF140 | ||
| Type: protein-coding gene | Cytoband: 12q24.13 | ||
| Entrez ID: 1840 | HGNC ID: HGNC:3060 | Ensembl Gene: ENSG00000135144 | OMIM ID: 602582 |
DTX1 involved pathways:
| KEGG pathway | Description | View |
|---|---|---|
| hsa04330 | Notch signaling pathway |
Expression of DTX1:
| Dataset | Gene | EntrezID | Probe | Log2FC | Adj.pValue | Expression |
|---|---|---|---|---|---|---|
| GSE17351 | DTX1 | 1840 | 227336_at | 0.1178 | 0.8356 | |
| GSE26886 | DTX1 | 1840 | 227336_at | 0.2021 | 0.2747 | |
| GSE45670 | DTX1 | 1840 | 227336_at | -0.0000 | 0.9998 | |
| GSE53622 | DTX1 | 1840 | 85481 | -0.0938 | 0.6012 | |
| GSE53624 | DTX1 | 1840 | 85481 | -0.0625 | 0.6534 | |
| GSE63941 | DTX1 | 1840 | 227336_at | 0.1226 | 0.5454 | |
| GSE77861 | DTX1 | 1840 | 227336_at | -0.0155 | 0.9314 | |
| GSE97050 | DTX1 | 1840 | A_24_P290751 | -0.1407 | 0.6498 | |
| SRP064894 | DTX1 | 1840 | RNAseq | -0.2963 | 0.3555 | |
| SRP133303 | DTX1 | 1840 | RNAseq | -0.5963 | 0.0039 | |
| SRP159526 | DTX1 | 1840 | RNAseq | -1.0608 | 0.0487 | |
| SRP193095 | DTX1 | 1840 | RNAseq | -0.6964 | 0.0084 | |
| SRP219564 | DTX1 | 1840 | RNAseq | -0.5497 | 0.2164 | |
| TCGA | DTX1 | 1840 | RNAseq | -0.0635 | 0.6986 |
Upregulated datasets: 0; Downregulated datasets: 1.
Survival by DTX1 expression:
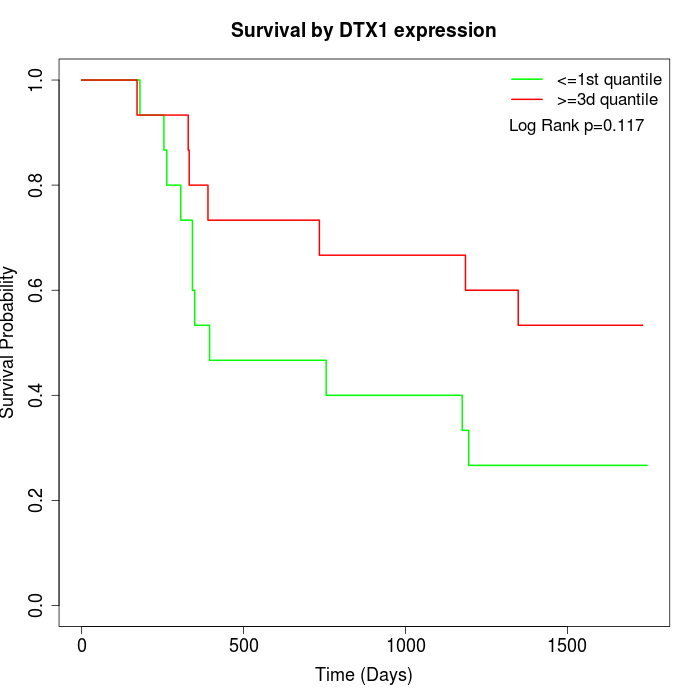 | 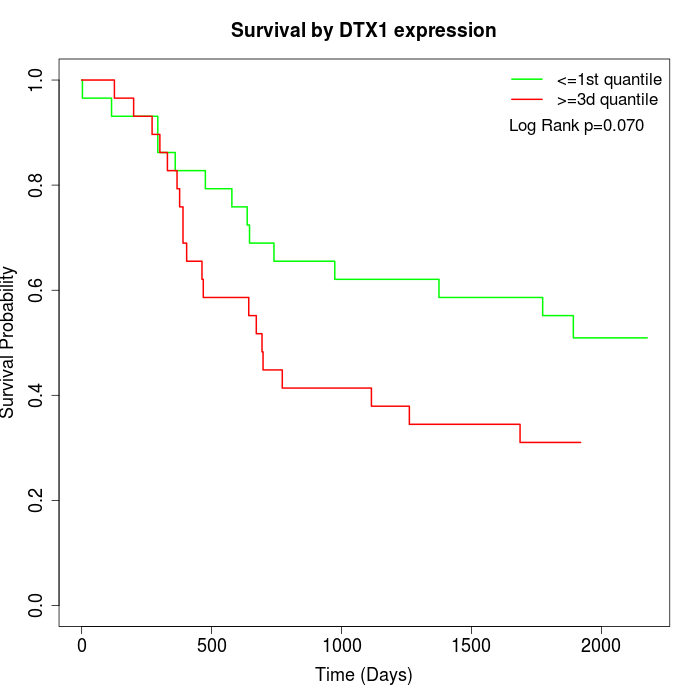 | 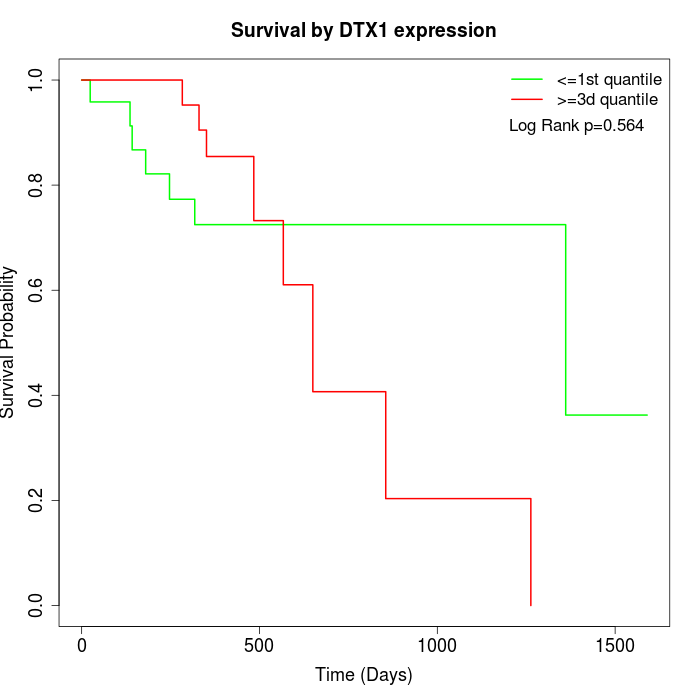 |
| GSE53622 | GSE53624 | TCGA |
Note: Click image to view full size file.
Copy number change of DTX1:
| Dataset | Gene | EntrezID | Gain | Loss | Normal | Detail |
|---|---|---|---|---|---|---|
| GSE15526 | DTX1 | 1840 | 4 | 3 | 23 | |
| GSE20123 | DTX1 | 1840 | 4 | 3 | 23 | |
| GSE43470 | DTX1 | 1840 | 2 | 0 | 41 | |
| GSE46452 | DTX1 | 1840 | 9 | 1 | 49 | |
| GSE47630 | DTX1 | 1840 | 9 | 3 | 28 | |
| GSE54993 | DTX1 | 1840 | 0 | 5 | 65 | |
| GSE54994 | DTX1 | 1840 | 4 | 2 | 47 | |
| GSE60625 | DTX1 | 1840 | 0 | 0 | 11 | |
| GSE74703 | DTX1 | 1840 | 2 | 0 | 34 | |
| GSE74704 | DTX1 | 1840 | 2 | 2 | 16 | |
| TCGA | DTX1 | 1840 | 22 | 11 | 63 |
Total number of gains: 58; Total number of losses: 30; Total Number of normals: 400.
Somatic mutations of DTX1:
Generating mutation plots.
Highly correlated genes for DTX1:
Showing top 20/157 corelated genes with mean PCC>0.5.
| Gene1 | Gene2 | Mean PCC | Num. Datasets | Num. PCC<0 | Num. PCC>0.5 |
|---|---|---|---|---|---|
| DTX1 | IRF2BP1 | 0.7098 | 3 | 0 | 3 |
| DTX1 | PCGF2 | 0.698918 | 3 | 0 | 3 |
| DTX1 | CETP | 0.690569 | 3 | 0 | 3 |
| DTX1 | KIR2DL2 | 0.680431 | 3 | 0 | 3 |
| DTX1 | BTBD6 | 0.679145 | 3 | 0 | 3 |
| DTX1 | RGS18 | 0.677298 | 4 | 0 | 4 |
| DTX1 | ADAM19 | 0.666807 | 3 | 0 | 3 |
| DTX1 | MRM1 | 0.665614 | 4 | 0 | 4 |
| DTX1 | HRH3 | 0.664111 | 3 | 0 | 3 |
| DTX1 | CXCR5 | 0.663215 | 4 | 0 | 3 |
| DTX1 | IGFBP4 | 0.662301 | 3 | 0 | 3 |
| DTX1 | LITAF | 0.659503 | 3 | 0 | 3 |
| DTX1 | ITGB3 | 0.651216 | 4 | 0 | 3 |
| DTX1 | INO80B | 0.648158 | 3 | 0 | 3 |
| DTX1 | INTS1 | 0.634793 | 3 | 0 | 3 |
| DTX1 | SOX17 | 0.634542 | 3 | 0 | 3 |
| DTX1 | LMO1 | 0.626131 | 4 | 0 | 3 |
| DTX1 | CCDC151 | 0.624938 | 4 | 0 | 3 |
| DTX1 | STK4 | 0.624313 | 3 | 0 | 3 |
| DTX1 | HSPA1L | 0.621695 | 3 | 0 | 3 |
For details and further investigation, click here