| Full name: isthmin 1 | Alias Symbol: bA149I18.1 | ||
| Type: protein-coding gene | Cytoband: 20p12.1 | ||
| Entrez ID: 140862 | HGNC ID: HGNC:16213 | Ensembl Gene: ENSG00000101230 | OMIM ID: 615793 |
Expression of ISM1:
| Dataset | Gene | EntrezID | Probe | Log2FC | Adj.pValue | Expression |
|---|---|---|---|---|---|---|
| GSE17351 | ISM1 | 140862 | 235182_at | -0.4127 | 0.6675 | |
| GSE26886 | ISM1 | 140862 | 235182_at | 0.0227 | 0.9577 | |
| GSE45670 | ISM1 | 140862 | 235182_at | -0.5305 | 0.1990 | |
| GSE53622 | ISM1 | 140862 | 16504 | 0.1628 | 0.4520 | |
| GSE53624 | ISM1 | 140862 | 16504 | 0.0261 | 0.8894 | |
| GSE63941 | ISM1 | 140862 | 235182_at | -1.3049 | 0.0035 | |
| GSE77861 | ISM1 | 140862 | 232888_at | 0.0400 | 0.6550 | |
| GSE97050 | ISM1 | 140862 | A_32_P186731 | 1.1953 | 0.1623 | |
| SRP007169 | ISM1 | 140862 | RNAseq | -0.1309 | 0.8178 | |
| SRP064894 | ISM1 | 140862 | RNAseq | 0.0871 | 0.7941 | |
| SRP133303 | ISM1 | 140862 | RNAseq | 0.2805 | 0.3784 | |
| SRP159526 | ISM1 | 140862 | RNAseq | 0.3864 | 0.4242 | |
| SRP219564 | ISM1 | 140862 | RNAseq | 2.0364 | 0.0232 | |
| TCGA | ISM1 | 140862 | RNAseq | 0.4403 | 0.0169 |
Upregulated datasets: 1; Downregulated datasets: 1.
Survival by ISM1 expression:
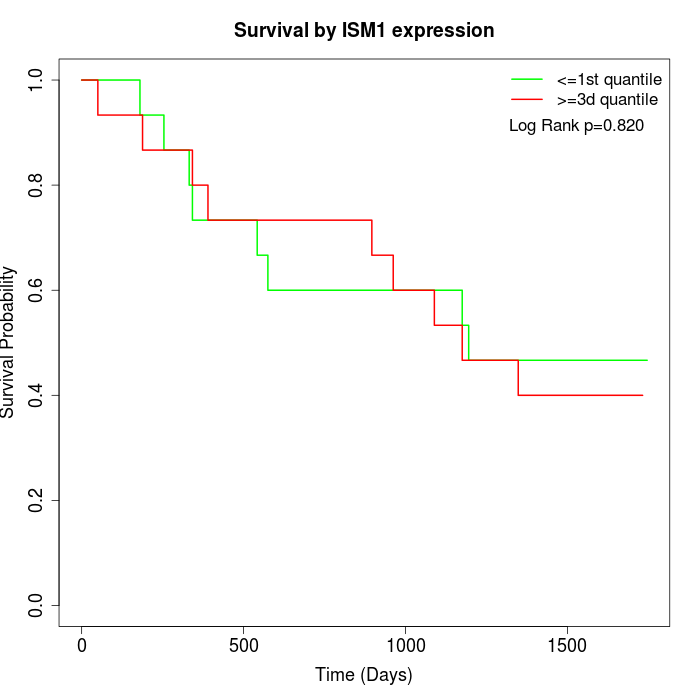 | 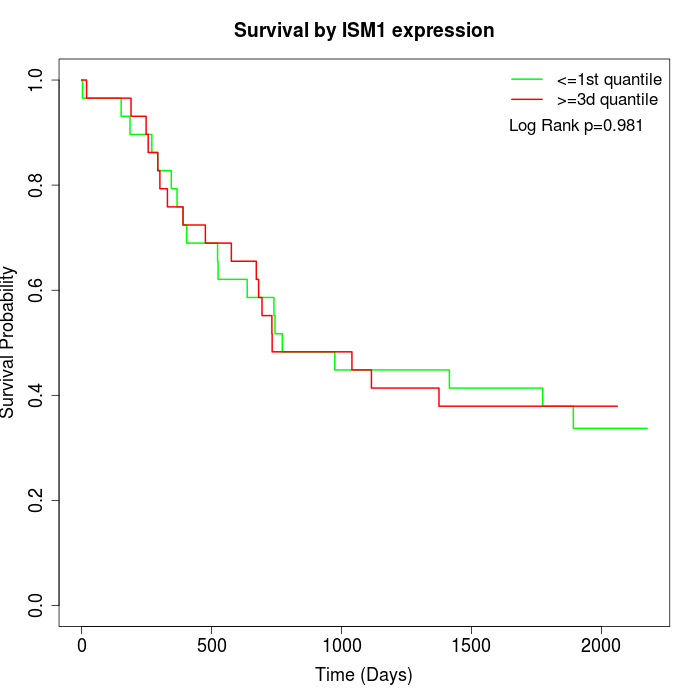 | 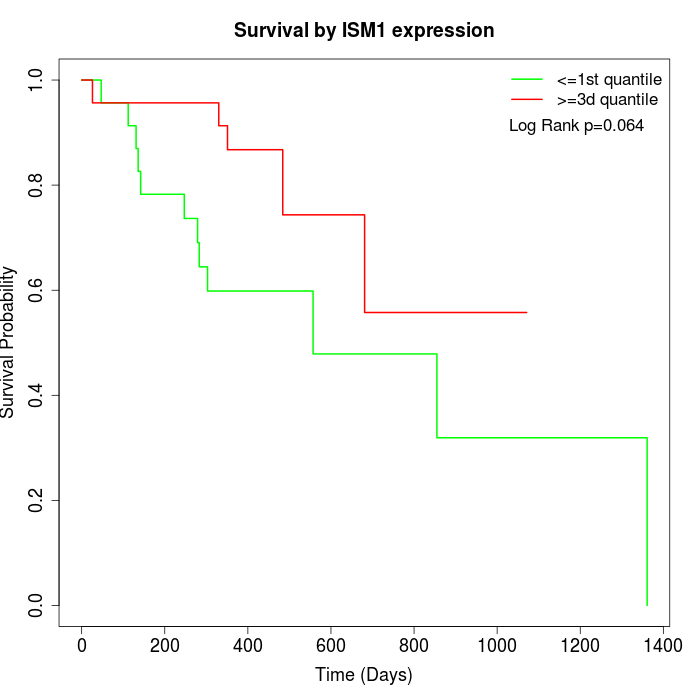 |
| GSE53622 | GSE53624 | TCGA |
Note: Click image to view full size file.
Copy number change of ISM1:
| Dataset | Gene | EntrezID | Gain | Loss | Normal | Detail |
|---|---|---|---|---|---|---|
| GSE15526 | ISM1 | 140862 | 10 | 1 | 19 | |
| GSE20123 | ISM1 | 140862 | 10 | 1 | 19 | |
| GSE43470 | ISM1 | 140862 | 11 | 1 | 31 | |
| GSE46452 | ISM1 | 140862 | 26 | 1 | 32 | |
| GSE47630 | ISM1 | 140862 | 18 | 4 | 18 | |
| GSE54993 | ISM1 | 140862 | 1 | 15 | 54 | |
| GSE54994 | ISM1 | 140862 | 25 | 1 | 27 | |
| GSE60625 | ISM1 | 140862 | 0 | 0 | 11 | |
| GSE74703 | ISM1 | 140862 | 8 | 1 | 27 | |
| GSE74704 | ISM1 | 140862 | 5 | 1 | 14 | |
| TCGA | ISM1 | 140862 | 42 | 10 | 44 |
Total number of gains: 156; Total number of losses: 36; Total Number of normals: 296.
Somatic mutations of ISM1:
Generating mutation plots.
Highly correlated genes for ISM1:
Showing top 20/46 corelated genes with mean PCC>0.5.
| Gene1 | Gene2 | Mean PCC | Num. Datasets | Num. PCC<0 | Num. PCC>0.5 |
|---|---|---|---|---|---|
| ISM1 | QSOX1 | 0.681908 | 3 | 0 | 3 |
| ISM1 | MICAL1 | 0.680014 | 3 | 0 | 3 |
| ISM1 | NFATC4 | 0.667217 | 3 | 0 | 3 |
| ISM1 | ADAMTS5 | 0.650769 | 4 | 0 | 4 |
| ISM1 | BMP6 | 0.63037 | 3 | 0 | 3 |
| ISM1 | IL7R | 0.628576 | 3 | 0 | 3 |
| ISM1 | FMOD | 0.625611 | 4 | 0 | 3 |
| ISM1 | CREB3L1 | 0.623213 | 3 | 0 | 3 |
| ISM1 | FCGR2A | 0.62166 | 3 | 0 | 3 |
| ISM1 | NDRG1 | 0.609596 | 4 | 0 | 3 |
| ISM1 | ARL4C | 0.593513 | 4 | 0 | 3 |
| ISM1 | THY1 | 0.590838 | 4 | 0 | 3 |
| ISM1 | MAX | 0.588646 | 3 | 0 | 3 |
| ISM1 | CCR8 | 0.581456 | 3 | 0 | 3 |
| ISM1 | DCBLD1 | 0.581068 | 3 | 0 | 3 |
| ISM1 | PDE7B | 0.577901 | 4 | 0 | 4 |
| ISM1 | FXYD5 | 0.577192 | 4 | 0 | 3 |
| ISM1 | SLC28A3 | 0.573393 | 3 | 0 | 3 |
| ISM1 | AIM2 | 0.571886 | 3 | 0 | 3 |
| ISM1 | MAF | 0.570157 | 4 | 0 | 3 |
For details and further investigation, click here