| Full name: integrin subunit beta 5 | Alias Symbol: | ||
| Type: protein-coding gene | Cytoband: 3q21.2 | ||
| Entrez ID: 3693 | HGNC ID: HGNC:6160 | Ensembl Gene: ENSG00000082781 | OMIM ID: 147561 |
| Drug and gene relationship at DGIdb | |||
Screen Evidence:
| |||
ITGB5 involved pathways:
| KEGG pathway | Description | View |
|---|---|---|
| hsa04151 | PI3K-Akt signaling pathway | |
| hsa04510 | Focal adhesion | |
| hsa04810 | Regulation of actin cytoskeleton | |
| hsa05205 | Proteoglycans in cancer |
Expression of ITGB5:
| Dataset | Gene | EntrezID | Probe | Log2FC | Adj.pValue | Expression |
|---|---|---|---|---|---|---|
| GSE17351 | ITGB5 | 3693 | 201125_s_at | -0.2386 | 0.5922 | |
| GSE20347 | ITGB5 | 3693 | 201125_s_at | -0.0788 | 0.7159 | |
| GSE23400 | ITGB5 | 3693 | 201125_s_at | 0.1557 | 0.0700 | |
| GSE26886 | ITGB5 | 3693 | 201125_s_at | 0.0226 | 0.9323 | |
| GSE29001 | ITGB5 | 3693 | 201125_s_at | 0.1296 | 0.6112 | |
| GSE38129 | ITGB5 | 3693 | 201125_s_at | 0.0552 | 0.7305 | |
| GSE45670 | ITGB5 | 3693 | 201125_s_at | -0.1578 | 0.3952 | |
| GSE53622 | ITGB5 | 3693 | 163990 | 0.4508 | 0.0000 | |
| GSE53624 | ITGB5 | 3693 | 163990 | 0.3436 | 0.0003 | |
| GSE63941 | ITGB5 | 3693 | 201125_s_at | -1.9872 | 0.0006 | |
| GSE77861 | ITGB5 | 3693 | 214020_x_at | 0.1510 | 0.4166 | |
| GSE97050 | ITGB5 | 3693 | A_23_P166633 | 0.4009 | 0.3222 | |
| SRP007169 | ITGB5 | 3693 | RNAseq | -0.1867 | 0.6301 | |
| SRP008496 | ITGB5 | 3693 | RNAseq | 0.3708 | 0.2357 | |
| SRP064894 | ITGB5 | 3693 | RNAseq | 0.4444 | 0.0097 | |
| SRP133303 | ITGB5 | 3693 | RNAseq | 0.6326 | 0.0134 | |
| SRP159526 | ITGB5 | 3693 | RNAseq | 0.0693 | 0.7914 | |
| SRP193095 | ITGB5 | 3693 | RNAseq | 0.4780 | 0.0078 | |
| SRP219564 | ITGB5 | 3693 | RNAseq | 0.2714 | 0.4968 | |
| TCGA | ITGB5 | 3693 | RNAseq | 0.1078 | 0.0734 |
Upregulated datasets: 0; Downregulated datasets: 1.
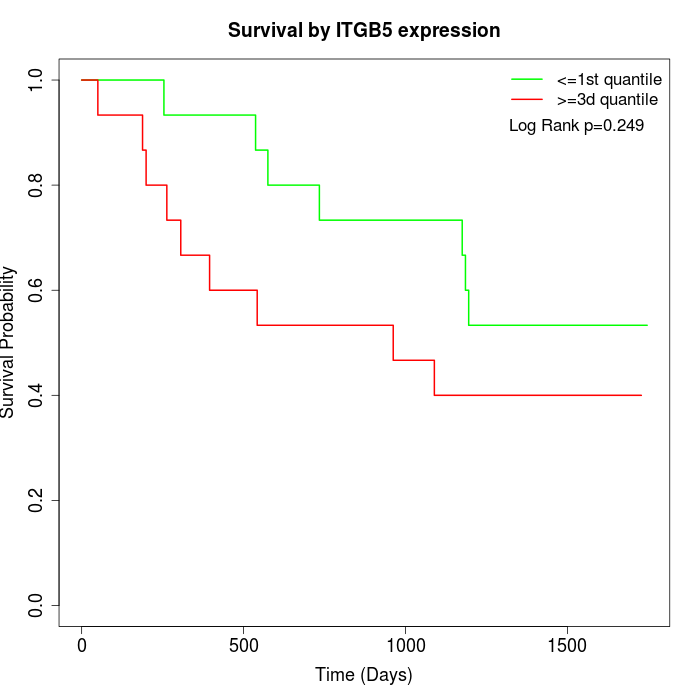
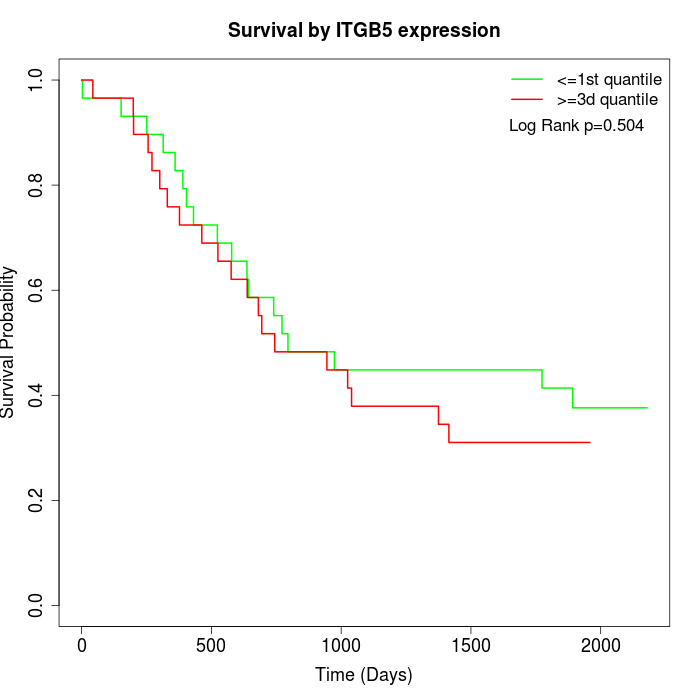
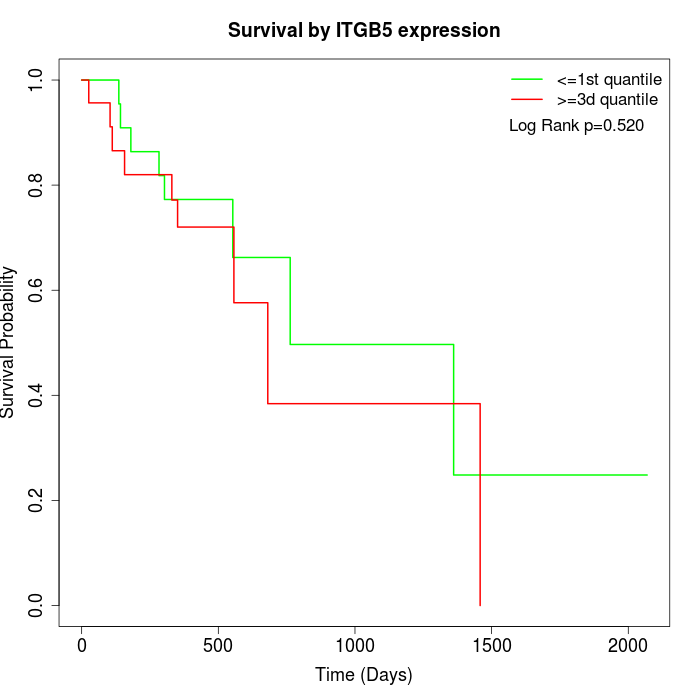
Survival by ITGB5 expression:
Note: Click image to view full size file.
Copy number change of ITGB5:
| Dataset | Gene | EntrezID | Gain | Loss | Normal | Detail |
|---|---|---|---|---|---|---|
| GSE15526 | ITGB5 | 3693 | 17 | 0 | 13 | |
| GSE20123 | ITGB5 | 3693 | 17 | 0 | 13 | |
| GSE43470 | ITGB5 | 3693 | 20 | 0 | 23 | |
| GSE46452 | ITGB5 | 3693 | 14 | 5 | 40 | |
| GSE47630 | ITGB5 | 3693 | 17 | 4 | 19 | |
| GSE54993 | ITGB5 | 3693 | 2 | 7 | 61 | |
| GSE54994 | ITGB5 | 3693 | 31 | 3 | 19 | |
| GSE60625 | ITGB5 | 3693 | 0 | 6 | 5 | |
| GSE74703 | ITGB5 | 3693 | 17 | 0 | 19 | |
| GSE74704 | ITGB5 | 3693 | 13 | 0 | 7 | |
| TCGA | ITGB5 | 3693 | 56 | 6 | 34 |
Total number of gains: 204; Total number of losses: 31; Total Number of normals: 253.
Somatic mutations of ITGB5:
Generating mutation plots.
Highly correlated genes for ITGB5:
Showing top 20/200 corelated genes with mean PCC>0.5.
| Gene1 | Gene2 | Mean PCC | Num. Datasets | Num. PCC<0 | Num. PCC>0.5 |
|---|---|---|---|---|---|
| ITGB5 | ERGIC1 | 0.781012 | 3 | 0 | 3 |
| ITGB5 | SLC38A4 | 0.727901 | 3 | 0 | 3 |
| ITGB5 | AHRR | 0.707419 | 3 | 0 | 3 |
| ITGB5 | TRIP12 | 0.704967 | 3 | 0 | 3 |
| ITGB5 | AMPD3 | 0.68821 | 3 | 0 | 3 |
| ITGB5 | POLD4 | 0.686487 | 3 | 0 | 3 |
| ITGB5 | NDEL1 | 0.685407 | 3 | 0 | 3 |
| ITGB5 | ANGPTL4 | 0.672766 | 3 | 0 | 3 |
| ITGB5 | HECW2 | 0.671675 | 3 | 0 | 3 |
| ITGB5 | SEC61G | 0.670329 | 3 | 0 | 3 |
| ITGB5 | NCOA3 | 0.665511 | 3 | 0 | 3 |
| ITGB5 | SEC22C | 0.664261 | 3 | 0 | 3 |
| ITGB5 | CDK2AP1 | 0.664206 | 3 | 0 | 3 |
| ITGB5 | SUSD1 | 0.662183 | 4 | 0 | 4 |
| ITGB5 | GALNT1 | 0.659257 | 3 | 0 | 3 |
| ITGB5 | MAP4K4 | 0.644051 | 3 | 0 | 3 |
| ITGB5 | DHDDS | 0.643723 | 4 | 0 | 3 |
| ITGB5 | SNX33 | 0.643179 | 3 | 0 | 3 |
| ITGB5 | ARF4 | 0.638829 | 5 | 0 | 4 |
| ITGB5 | RPS27L | 0.634639 | 4 | 0 | 4 |
For details and further investigation, click here


