| Full name: MICAL C-terminal like | Alias Symbol: FLJ14966 | ||
| Type: protein-coding gene | Cytoband: 11p15.3 | ||
| Entrez ID: 84953 | HGNC ID: HGNC:25933 | Ensembl Gene: ENSG00000133808 | OMIM ID: 612355 |
Expression of MICALCL:
| Dataset | Gene | EntrezID | Probe | Log2FC | Adj.pValue | Expression |
|---|---|---|---|---|---|---|
| GSE17351 | MICALCL | 84953 | 243611_at | 0.4882 | 0.4006 | |
| GSE26886 | MICALCL | 84953 | 243611_at | 0.3531 | 0.0497 | |
| GSE45670 | MICALCL | 84953 | 243611_at | 0.4627 | 0.0118 | |
| GSE63941 | MICALCL | 84953 | 243611_at | 0.2482 | 0.4912 | |
| GSE77861 | MICALCL | 84953 | 243611_at | 0.0307 | 0.8054 | |
| GSE97050 | MICALCL | 84953 | A_23_P2041 | 0.9495 | 0.1189 | |
| SRP007169 | MICALCL | 84953 | RNAseq | 1.8399 | 0.0166 | |
| SRP064894 | MICALCL | 84953 | RNAseq | 1.1395 | 0.0000 | |
| SRP133303 | MICALCL | 84953 | RNAseq | 2.2775 | 0.0000 | |
| SRP159526 | MICALCL | 84953 | RNAseq | -0.0812 | 0.8541 | |
| SRP193095 | MICALCL | 84953 | RNAseq | 0.9130 | 0.0013 | |
| SRP219564 | MICALCL | 84953 | RNAseq | 0.5436 | 0.3299 | |
| TCGA | MICALCL | 84953 | RNAseq | 0.3148 | 0.1862 |
Upregulated datasets: 3; Downregulated datasets: 0.
Survival by MICALCL expression:
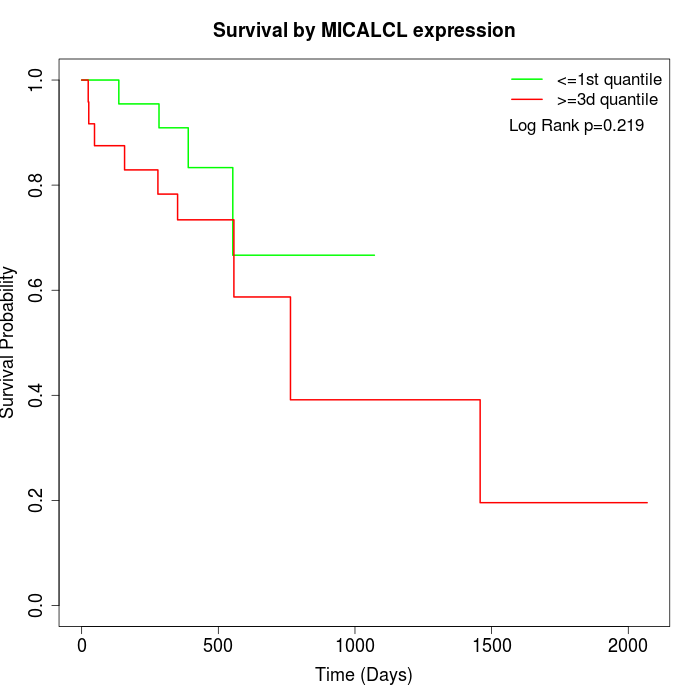 |
| TCGA |
Note: Click image to view full size file.
Copy number change of MICALCL:
| Dataset | Gene | EntrezID | Gain | Loss | Normal | Detail |
|---|---|---|---|---|---|---|
| GSE15526 | MICALCL | 84953 | 0 | 9 | 21 | |
| GSE20123 | MICALCL | 84953 | 0 | 9 | 21 | |
| GSE43470 | MICALCL | 84953 | 1 | 5 | 37 | |
| GSE46452 | MICALCL | 84953 | 7 | 5 | 47 | |
| GSE47630 | MICALCL | 84953 | 3 | 11 | 26 | |
| GSE54993 | MICALCL | 84953 | 3 | 1 | 66 | |
| GSE54994 | MICALCL | 84953 | 4 | 12 | 37 | |
| GSE60625 | MICALCL | 84953 | 0 | 0 | 11 | |
| GSE74703 | MICALCL | 84953 | 1 | 3 | 32 | |
| GSE74704 | MICALCL | 84953 | 0 | 7 | 13 | |
| TCGA | MICALCL | 84953 | 11 | 32 | 53 |
Total number of gains: 30; Total number of losses: 94; Total Number of normals: 364.
Somatic mutations of MICALCL:
Generating mutation plots.
Highly correlated genes for MICALCL:
Showing top 20/333 corelated genes with mean PCC>0.5.
| Gene1 | Gene2 | Mean PCC | Num. Datasets | Num. PCC<0 | Num. PCC>0.5 |
|---|---|---|---|---|---|
| MICALCL | BZW2 | 0.808949 | 3 | 0 | 3 |
| MICALCL | GPR158 | 0.779758 | 3 | 0 | 3 |
| MICALCL | GPR153 | 0.778857 | 4 | 0 | 4 |
| MICALCL | USP14 | 0.776134 | 3 | 0 | 3 |
| MICALCL | LILRB2 | 0.774648 | 3 | 0 | 3 |
| MICALCL | THOC6 | 0.773928 | 3 | 0 | 3 |
| MICALCL | LRRC42 | 0.767542 | 3 | 0 | 3 |
| MICALCL | CRCP | 0.753018 | 3 | 0 | 3 |
| MICALCL | NCLN | 0.73491 | 5 | 0 | 5 |
| MICALCL | BRMS1 | 0.727196 | 3 | 0 | 3 |
| MICALCL | TNFRSF9 | 0.722173 | 3 | 0 | 3 |
| MICALCL | SEC61G | 0.715637 | 3 | 0 | 3 |
| MICALCL | CYP27C1 | 0.715599 | 4 | 0 | 4 |
| MICALCL | MRTO4 | 0.714532 | 3 | 0 | 3 |
| MICALCL | AIM2 | 0.709781 | 3 | 0 | 3 |
| MICALCL | ZAP70 | 0.706388 | 3 | 0 | 3 |
| MICALCL | STRIP2 | 0.706083 | 3 | 0 | 3 |
| MICALCL | LSM5 | 0.70537 | 4 | 0 | 4 |
| MICALCL | FBLIM1 | 0.704044 | 4 | 0 | 4 |
| MICALCL | CD3EAP | 0.704 | 4 | 0 | 4 |
For details and further investigation, click here