| Full name: mediator complex subunit 19 | Alias Symbol: LCMR1 | ||
| Type: protein-coding gene | Cytoband: 11q12.1 | ||
| Entrez ID: 219541 | HGNC ID: HGNC:29600 | Ensembl Gene: ENSG00000156603 | OMIM ID: 612385 |
Screen Evidence:
| |||
Expression of MED19:
| Dataset | Gene | EntrezID | Probe | Log2FC | Adj.pValue | Expression |
|---|---|---|---|---|---|---|
| GSE17351 | MED19 | 219541 | 226300_at | 0.1956 | 0.4668 | |
| GSE26886 | MED19 | 219541 | 226300_at | 0.8298 | 0.0000 | |
| GSE45670 | MED19 | 219541 | 226300_at | 0.4215 | 0.0002 | |
| GSE53622 | MED19 | 219541 | 55482 | 0.3796 | 0.0000 | |
| GSE53624 | MED19 | 219541 | 55482 | 0.3984 | 0.0000 | |
| GSE63941 | MED19 | 219541 | 226300_at | 0.3091 | 0.5143 | |
| GSE77861 | MED19 | 219541 | 226293_at | 0.1190 | 0.4806 | |
| GSE97050 | MED19 | 219541 | A_23_P150510 | 0.0732 | 0.7449 | |
| SRP007169 | MED19 | 219541 | RNAseq | -0.2484 | 0.4914 | |
| SRP008496 | MED19 | 219541 | RNAseq | -0.0940 | 0.6905 | |
| SRP064894 | MED19 | 219541 | RNAseq | 0.2799 | 0.1758 | |
| SRP133303 | MED19 | 219541 | RNAseq | -0.0019 | 0.9924 | |
| SRP159526 | MED19 | 219541 | RNAseq | 0.2117 | 0.5090 | |
| SRP193095 | MED19 | 219541 | RNAseq | 0.0195 | 0.8642 | |
| SRP219564 | MED19 | 219541 | RNAseq | 0.1231 | 0.6764 | |
| TCGA | MED19 | 219541 | RNAseq | 0.2400 | 0.0003 |
Upregulated datasets: 0; Downregulated datasets: 0.
Survival by MED19 expression:
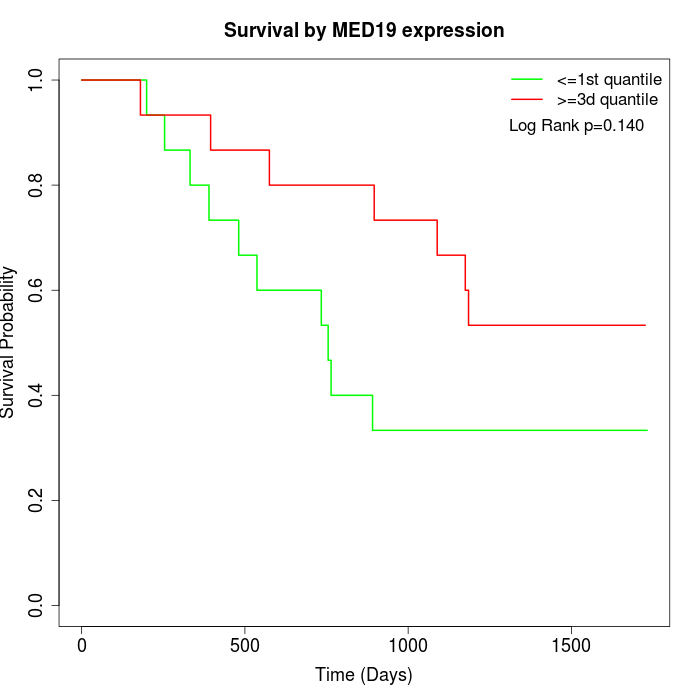 | 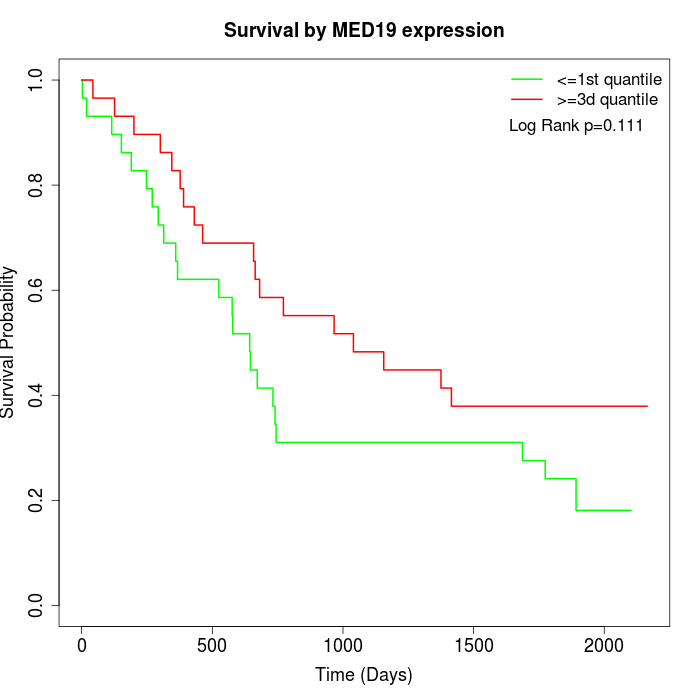 | 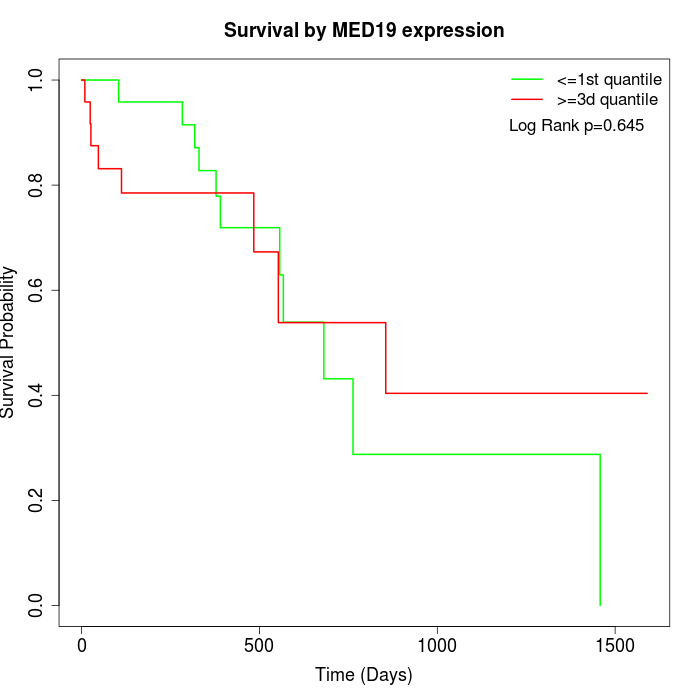 |
| GSE53622 | GSE53624 | TCGA |
Note: Click image to view full size file.
Copy number change of MED19:
| Dataset | Gene | EntrezID | Gain | Loss | Normal | Detail |
|---|---|---|---|---|---|---|
| GSE15526 | MED19 | 219541 | 2 | 3 | 25 | |
| GSE20123 | MED19 | 219541 | 2 | 3 | 25 | |
| GSE43470 | MED19 | 219541 | 1 | 5 | 37 | |
| GSE46452 | MED19 | 219541 | 9 | 4 | 46 | |
| GSE47630 | MED19 | 219541 | 3 | 8 | 29 | |
| GSE54993 | MED19 | 219541 | 3 | 0 | 67 | |
| GSE54994 | MED19 | 219541 | 5 | 6 | 42 | |
| GSE60625 | MED19 | 219541 | 0 | 3 | 8 | |
| GSE74703 | MED19 | 219541 | 1 | 3 | 32 | |
| GSE74704 | MED19 | 219541 | 2 | 3 | 15 | |
| TCGA | MED19 | 219541 | 14 | 10 | 72 |
Total number of gains: 42; Total number of losses: 48; Total Number of normals: 398.
Somatic mutations of MED19:
Generating mutation plots.
Highly correlated genes for MED19:
Showing top 20/792 corelated genes with mean PCC>0.5.
| Gene1 | Gene2 | Mean PCC | Num. Datasets | Num. PCC<0 | Num. PCC>0.5 |
|---|---|---|---|---|---|
| MED19 | TMEM223 | 0.743894 | 4 | 0 | 4 |
| MED19 | MCMBP | 0.74258 | 3 | 0 | 3 |
| MED19 | DPP3 | 0.738865 | 4 | 0 | 3 |
| MED19 | MGAT4B | 0.731258 | 3 | 0 | 3 |
| MED19 | POLA1 | 0.727408 | 3 | 0 | 3 |
| MED19 | NPRL3 | 0.724264 | 3 | 0 | 3 |
| MED19 | HIVEP1 | 0.713306 | 3 | 0 | 3 |
| MED19 | CALML5 | 0.705211 | 3 | 0 | 3 |
| MED19 | SLC45A3 | 0.697302 | 3 | 0 | 3 |
| MED19 | C1orf112 | 0.692818 | 4 | 0 | 4 |
| MED19 | TRIT1 | 0.687424 | 3 | 0 | 3 |
| MED19 | TSPAN1 | 0.679204 | 3 | 0 | 3 |
| MED19 | ANAPC5 | 0.678519 | 4 | 0 | 3 |
| MED19 | BIRC5 | 0.678434 | 5 | 0 | 5 |
| MED19 | PAM16 | 0.678308 | 3 | 0 | 3 |
| MED19 | SENP1 | 0.67738 | 3 | 0 | 3 |
| MED19 | NUP85 | 0.675215 | 5 | 0 | 4 |
| MED19 | FABP4 | 0.670396 | 3 | 0 | 3 |
| MED19 | PFAS | 0.664962 | 5 | 0 | 3 |
| MED19 | MED26 | 0.664721 | 3 | 0 | 3 |
For details and further investigation, click here