| Full name: MAX dimerization protein MGA | Alias Symbol: KIAA0518|MAD5|MXD5|FLJ12634 | ||
| Type: protein-coding gene | Cytoband: 15q15 | ||
| Entrez ID: 23269 | HGNC ID: HGNC:14010 | Ensembl Gene: ENSG00000174197 | OMIM ID: 616061 |
| Related drugs: ACARBOSE, MIGLITOL... [more] | |||
Screen Evidence:
| |||
Expression of MGA:
| Dataset | Gene | EntrezID | Probe | Log2FC | Adj.pValue | Expression |
|---|---|---|---|---|---|---|
| GSE20347 | MGA | 23269 | 212945_s_at | 0.1091 | 0.4063 | |
| GSE23400 | MGA | 23269 | 212945_s_at | 0.0795 | 0.1864 | |
| GSE29001 | MGA | 23269 | 212945_s_at | -0.0271 | 0.9566 | |
| GSE38129 | MGA | 23269 | 212945_s_at | 0.1708 | 0.0706 | |
| GSE45670 | MGA | 23269 | 212945_s_at | 0.1636 | 0.2460 | |
| GSE53622 | MGA | 23269 | 22318 | 0.3580 | 0.0000 | |
| GSE53624 | MGA | 23269 | 104205 | 0.1619 | 0.0041 | |
| GSE97050 | MGA | 23269 | A_33_P3330323 | 0.0261 | 0.9111 | |
| SRP007169 | MGA | 23269 | RNAseq | 0.3593 | 0.2375 | |
| SRP008496 | MGA | 23269 | RNAseq | 0.4050 | 0.0249 | |
| SRP064894 | MGA | 23269 | RNAseq | -0.0723 | 0.7003 | |
| SRP133303 | MGA | 23269 | RNAseq | 0.1070 | 0.4050 | |
| SRP159526 | MGA | 23269 | RNAseq | 0.0025 | 0.9914 | |
| SRP193095 | MGA | 23269 | RNAseq | 0.1927 | 0.0039 | |
| SRP219564 | MGA | 23269 | RNAseq | -0.0982 | 0.7132 | |
| TCGA | MGA | 23269 | RNAseq | -0.0337 | 0.4690 |
Upregulated datasets: 0; Downregulated datasets: 0.
Survival by MGA expression:
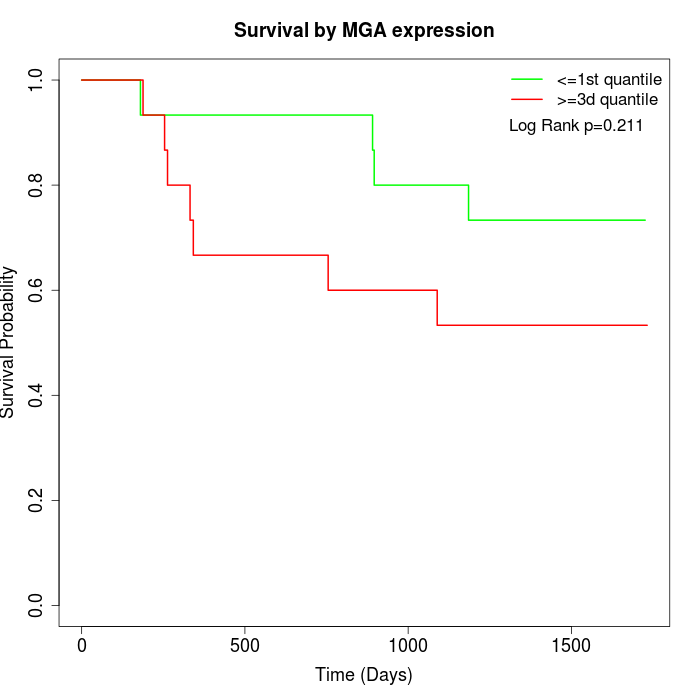 | 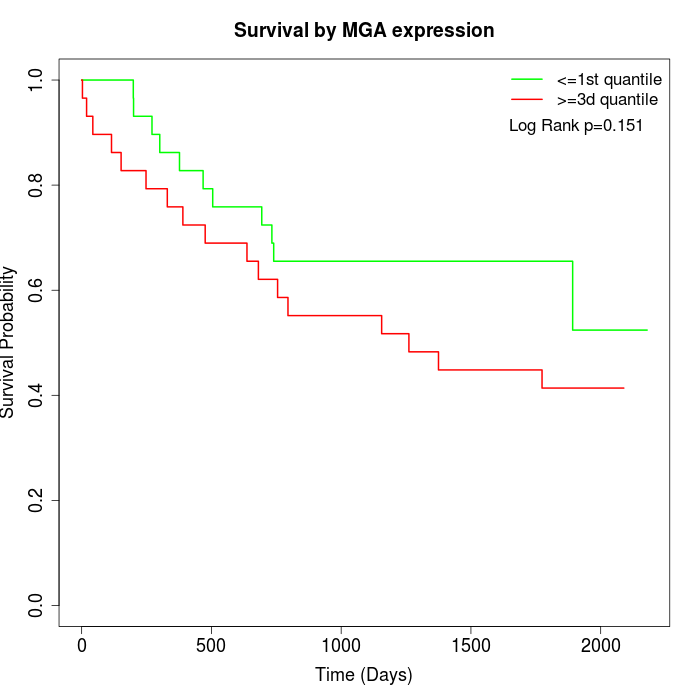 | 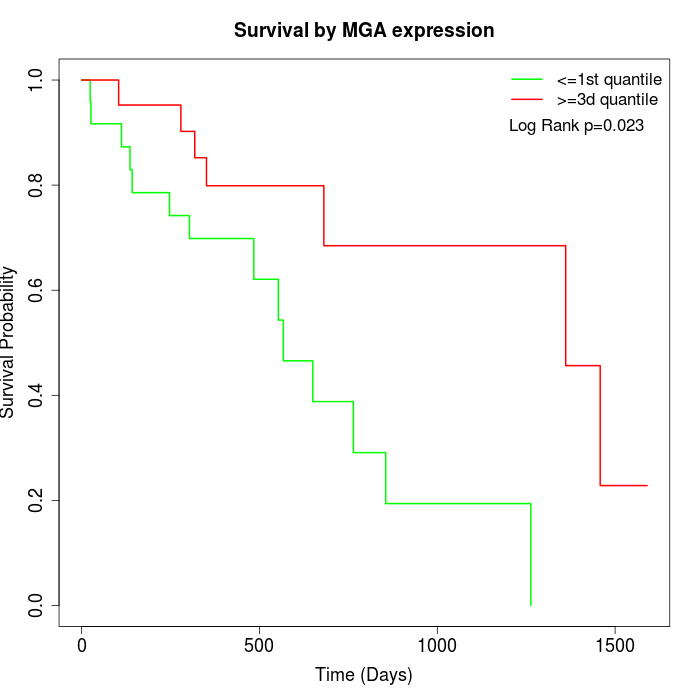 |
| GSE53622 | GSE53624 | TCGA |
Note: Click image to view full size file.
Copy number change of MGA:
| Dataset | Gene | EntrezID | Gain | Loss | Normal | Detail |
|---|---|---|---|---|---|---|
| GSE15526 | MGA | 23269 | 4 | 5 | 21 | |
| GSE20123 | MGA | 23269 | 4 | 5 | 21 | |
| GSE43470 | MGA | 23269 | 4 | 5 | 34 | |
| GSE46452 | MGA | 23269 | 3 | 7 | 49 | |
| GSE47630 | MGA | 23269 | 8 | 11 | 21 | |
| GSE54993 | MGA | 23269 | 4 | 6 | 60 | |
| GSE54994 | MGA | 23269 | 5 | 7 | 41 | |
| GSE60625 | MGA | 23269 | 4 | 0 | 7 | |
| GSE74703 | MGA | 23269 | 4 | 4 | 28 | |
| GSE74704 | MGA | 23269 | 3 | 3 | 14 | |
| TCGA | MGA | 23269 | 11 | 19 | 66 |
Total number of gains: 54; Total number of losses: 72; Total Number of normals: 362.
Somatic mutations of MGA:
Generating mutation plots.
Highly correlated genes for MGA:
Showing top 20/94 corelated genes with mean PCC>0.5.
| Gene1 | Gene2 | Mean PCC | Num. Datasets | Num. PCC<0 | Num. PCC>0.5 |
|---|---|---|---|---|---|
| MGA | LIPT1 | 0.754757 | 3 | 0 | 3 |
| MGA | BMPR2 | 0.73168 | 3 | 0 | 3 |
| MGA | SRPK1 | 0.702576 | 4 | 0 | 3 |
| MGA | POU2F1 | 0.681271 | 3 | 0 | 3 |
| MGA | ATF2 | 0.681194 | 4 | 0 | 3 |
| MGA | RBM23 | 0.673909 | 3 | 0 | 3 |
| MGA | DVL3 | 0.671708 | 3 | 0 | 3 |
| MGA | PDE6D | 0.671024 | 3 | 0 | 3 |
| MGA | MRPS22 | 0.665459 | 4 | 0 | 3 |
| MGA | MRPL9 | 0.663442 | 4 | 0 | 4 |
| MGA | KIN | 0.66156 | 4 | 0 | 3 |
| MGA | ERGIC2 | 0.658826 | 4 | 0 | 3 |
| MGA | C1orf50 | 0.657105 | 3 | 0 | 3 |
| MGA | MDN1 | 0.656005 | 4 | 0 | 3 |
| MGA | CNOT6 | 0.655205 | 3 | 0 | 3 |
| MGA | CDC123 | 0.654859 | 4 | 0 | 3 |
| MGA | GTF3C3 | 0.645589 | 5 | 0 | 4 |
| MGA | CELF1 | 0.645294 | 5 | 0 | 4 |
| MGA | KDM1A | 0.634779 | 4 | 0 | 3 |
| MGA | ATG3 | 0.633842 | 4 | 0 | 3 |
For details and further investigation, click here