| Full name: phosphoribosylaminoimidazole carboxylase and phosphoribosylaminoimidazolesuccinocarboxamide synthase | Alias Symbol: ADE2H1|AIRC | ||
| Type: protein-coding gene | Cytoband: 4q12 | ||
| Entrez ID: 10606 | HGNC ID: HGNC:8587 | Ensembl Gene: ENSG00000128050 | OMIM ID: 172439 |
Screen Evidence:
| |||
Expression of PAICS:
| Dataset | Gene | EntrezID | Probe | Log2FC | Adj.pValue | Expression |
|---|---|---|---|---|---|---|
| GSE17351 | PAICS | 10606 | 201013_s_at | 0.8652 | 0.0442 | |
| GSE20347 | PAICS | 10606 | 201013_s_at | 0.6230 | 0.0001 | |
| GSE23400 | PAICS | 10606 | 201013_s_at | 1.1189 | 0.0000 | |
| GSE26886 | PAICS | 10606 | 201013_s_at | 1.3365 | 0.0000 | |
| GSE29001 | PAICS | 10606 | 201013_s_at | 0.7449 | 0.0051 | |
| GSE38129 | PAICS | 10606 | 201013_s_at | 1.0689 | 0.0000 | |
| GSE45670 | PAICS | 10606 | 201013_s_at | 0.6326 | 0.0541 | |
| GSE53622 | PAICS | 10606 | 94475 | 0.8553 | 0.0000 | |
| GSE53624 | PAICS | 10606 | 94475 | 0.8657 | 0.0000 | |
| GSE63941 | PAICS | 10606 | 201013_s_at | 1.2746 | 0.0095 | |
| GSE77861 | PAICS | 10606 | 201013_s_at | 0.7145 | 0.0872 | |
| GSE97050 | PAICS | 10606 | A_24_P200427 | 0.6165 | 0.1316 | |
| SRP007169 | PAICS | 10606 | RNAseq | 0.8200 | 0.0746 | |
| SRP008496 | PAICS | 10606 | RNAseq | 0.9257 | 0.0000 | |
| SRP064894 | PAICS | 10606 | RNAseq | 0.5696 | 0.0145 | |
| SRP133303 | PAICS | 10606 | RNAseq | 0.8396 | 0.0000 | |
| SRP159526 | PAICS | 10606 | RNAseq | 0.5358 | 0.1562 | |
| SRP193095 | PAICS | 10606 | RNAseq | 0.3100 | 0.0472 | |
| SRP219564 | PAICS | 10606 | RNAseq | 0.1787 | 0.6709 | |
| TCGA | PAICS | 10606 | RNAseq | 0.3833 | 0.0000 |
Upregulated datasets: 4; Downregulated datasets: 0.
Survival by PAICS expression:
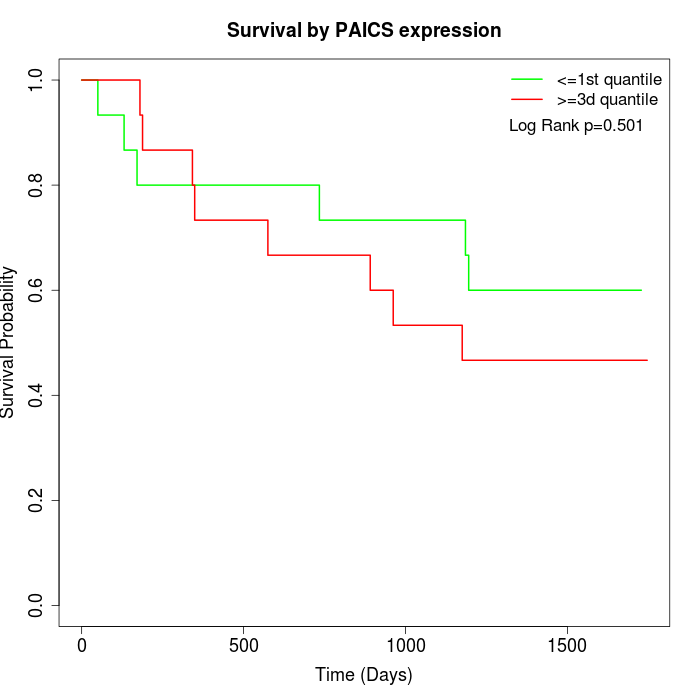 | 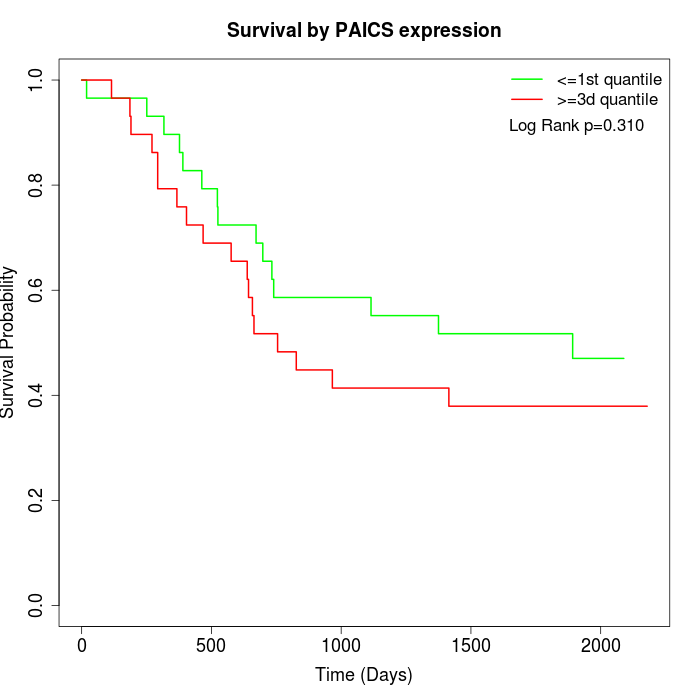 | 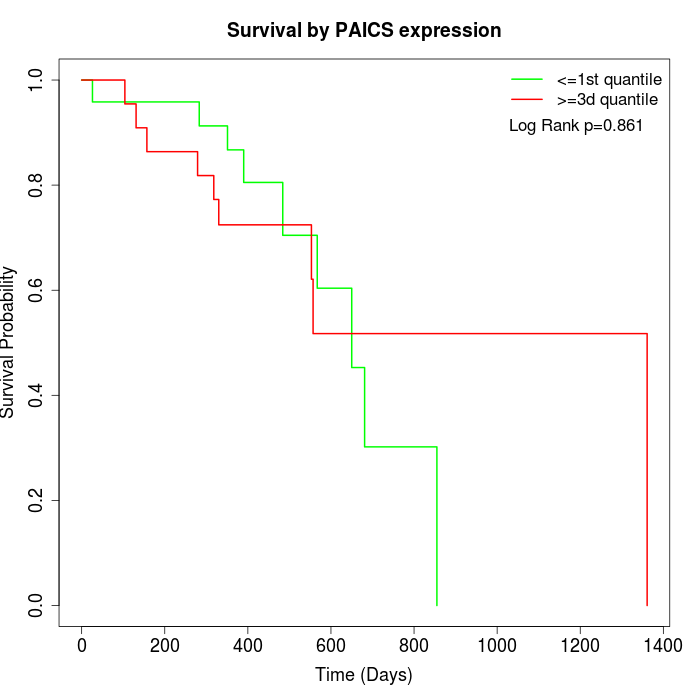 |
| GSE53622 | GSE53624 | TCGA |
Note: Click image to view full size file.
Copy number change of PAICS:
| Dataset | Gene | EntrezID | Gain | Loss | Normal | Detail |
|---|---|---|---|---|---|---|
| GSE15526 | PAICS | 10606 | 3 | 12 | 15 | |
| GSE20123 | PAICS | 10606 | 2 | 12 | 16 | |
| GSE43470 | PAICS | 10606 | 0 | 14 | 29 | |
| GSE46452 | PAICS | 10606 | 1 | 36 | 22 | |
| GSE47630 | PAICS | 10606 | 0 | 19 | 21 | |
| GSE54993 | PAICS | 10606 | 7 | 0 | 63 | |
| GSE54994 | PAICS | 10606 | 2 | 10 | 41 | |
| GSE60625 | PAICS | 10606 | 0 | 0 | 11 | |
| GSE74703 | PAICS | 10606 | 0 | 12 | 24 | |
| GSE74704 | PAICS | 10606 | 1 | 7 | 12 | |
| TCGA | PAICS | 10606 | 20 | 27 | 49 |
Total number of gains: 36; Total number of losses: 149; Total Number of normals: 303.
Somatic mutations of PAICS:
Generating mutation plots.
Highly correlated genes for PAICS:
Showing top 20/1818 corelated genes with mean PCC>0.5.
| Gene1 | Gene2 | Mean PCC | Num. Datasets | Num. PCC<0 | Num. PCC>0.5 |
|---|---|---|---|---|---|
| PAICS | MMS22L | 0.803771 | 3 | 0 | 3 |
| PAICS | CXCL16 | 0.771603 | 3 | 0 | 3 |
| PAICS | ECT2 | 0.758326 | 11 | 0 | 11 |
| PAICS | MCM6 | 0.754819 | 13 | 0 | 12 |
| PAICS | ZCCHC7 | 0.753401 | 3 | 0 | 3 |
| PAICS | GMPS | 0.753278 | 12 | 0 | 12 |
| PAICS | CISD2 | 0.753237 | 4 | 0 | 3 |
| PAICS | TTK | 0.752011 | 12 | 0 | 12 |
| PAICS | XPOT | 0.745375 | 9 | 0 | 9 |
| PAICS | CCT5 | 0.743379 | 9 | 0 | 9 |
| PAICS | HPRT1 | 0.742121 | 12 | 0 | 12 |
| PAICS | PPAT | 0.741897 | 12 | 0 | 12 |
| PAICS | UBE2T | 0.740633 | 9 | 0 | 9 |
| PAICS | GINS1 | 0.737907 | 12 | 0 | 11 |
| PAICS | SRSF2 | 0.735222 | 3 | 0 | 3 |
| PAICS | PPP1R16A | 0.733333 | 3 | 0 | 3 |
| PAICS | MCM4 | 0.731251 | 13 | 0 | 12 |
| PAICS | DNMT1 | 0.729946 | 12 | 0 | 11 |
| PAICS | KNSTRN | 0.729068 | 7 | 0 | 7 |
| PAICS | CDK2AP2 | 0.72879 | 3 | 0 | 3 |
For details and further investigation, click here