| Full name: peptidase inhibitor 15 | Alias Symbol: P25TI | ||
| Type: protein-coding gene | Cytoband: 8q21.13 | ||
| Entrez ID: 51050 | HGNC ID: HGNC:8946 | Ensembl Gene: ENSG00000137558 | OMIM ID: 607076 |
Expression of PI15:
| Dataset | Gene | EntrezID | Probe | Log2FC | Adj.pValue | Expression |
|---|---|---|---|---|---|---|
| GSE17351 | PI15 | 51050 | 229947_at | 1.7140 | 0.2896 | |
| GSE20347 | PI15 | 51050 | 207938_at | 0.1093 | 0.1667 | |
| GSE23400 | PI15 | 51050 | 207938_at | -0.0302 | 0.4719 | |
| GSE26886 | PI15 | 51050 | 207938_at | -0.0670 | 0.6087 | |
| GSE29001 | PI15 | 51050 | 207938_at | 0.0324 | 0.9047 | |
| GSE38129 | PI15 | 51050 | 207938_at | 0.0258 | 0.7391 | |
| GSE45670 | PI15 | 51050 | 229947_at | 0.8902 | 0.2550 | |
| GSE53622 | PI15 | 51050 | 10381 | 0.9009 | 0.0000 | |
| GSE53624 | PI15 | 51050 | 10381 | 0.8957 | 0.0000 | |
| GSE63941 | PI15 | 51050 | 207938_at | 0.3595 | 0.7330 | |
| GSE77861 | PI15 | 51050 | 229947_at | 0.5804 | 0.0225 | |
| GSE97050 | PI15 | 51050 | A_33_P3254096 | 1.3973 | 0.0620 | |
| SRP007169 | PI15 | 51050 | RNAseq | 2.7218 | 0.0004 | |
| SRP008496 | PI15 | 51050 | RNAseq | 3.2021 | 0.0000 | |
| SRP064894 | PI15 | 51050 | RNAseq | 2.3385 | 0.0000 | |
| SRP133303 | PI15 | 51050 | RNAseq | 1.6307 | 0.0001 | |
| SRP159526 | PI15 | 51050 | RNAseq | 1.3873 | 0.0275 | |
| SRP193095 | PI15 | 51050 | RNAseq | 4.2056 | 0.0000 | |
| SRP219564 | PI15 | 51050 | RNAseq | 0.2071 | 0.6979 | |
| TCGA | PI15 | 51050 | RNAseq | 0.1200 | 0.4586 |
Upregulated datasets: 6; Downregulated datasets: 0.
Survival by PI15 expression:
 | 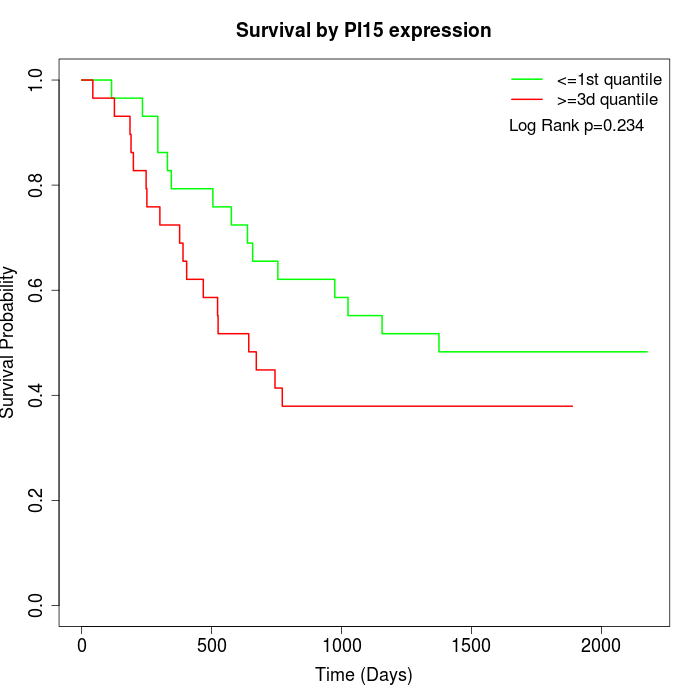 | 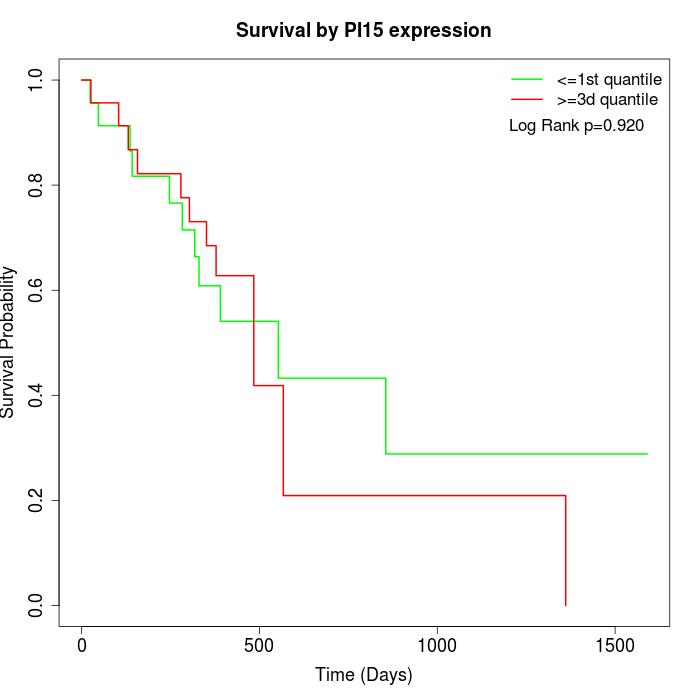 |
| GSE53622 | GSE53624 | TCGA |
Note: Click image to view full size file.
Copy number change of PI15:
| Dataset | Gene | EntrezID | Gain | Loss | Normal | Detail |
|---|---|---|---|---|---|---|
| GSE15526 | PI15 | 51050 | 15 | 1 | 14 | |
| GSE20123 | PI15 | 51050 | 16 | 1 | 13 | |
| GSE43470 | PI15 | 51050 | 19 | 1 | 23 | |
| GSE46452 | PI15 | 51050 | 22 | 0 | 37 | |
| GSE47630 | PI15 | 51050 | 23 | 0 | 17 | |
| GSE54993 | PI15 | 51050 | 0 | 19 | 51 | |
| GSE54994 | PI15 | 51050 | 30 | 0 | 23 | |
| GSE60625 | PI15 | 51050 | 0 | 4 | 7 | |
| GSE74703 | PI15 | 51050 | 16 | 1 | 19 | |
| GSE74704 | PI15 | 51050 | 11 | 0 | 9 | |
| TCGA | PI15 | 51050 | 51 | 2 | 43 |
Total number of gains: 203; Total number of losses: 29; Total Number of normals: 256.
Somatic mutations of PI15:
Generating mutation plots.
Highly correlated genes for PI15:
Showing top 20/426 corelated genes with mean PCC>0.5.
| Gene1 | Gene2 | Mean PCC | Num. Datasets | Num. PCC<0 | Num. PCC>0.5 |
|---|---|---|---|---|---|
| PI15 | DOC2B | 0.817951 | 3 | 0 | 3 |
| PI15 | LMAN1 | 0.767441 | 3 | 0 | 3 |
| PI15 | NRSN2 | 0.757919 | 3 | 0 | 3 |
| PI15 | ALPK2 | 0.750149 | 3 | 0 | 3 |
| PI15 | ABCC4 | 0.748943 | 4 | 0 | 4 |
| PI15 | HAS3 | 0.716327 | 4 | 0 | 3 |
| PI15 | LRRC59 | 0.710639 | 4 | 0 | 4 |
| PI15 | DERL1 | 0.704355 | 3 | 0 | 3 |
| PI15 | CD226 | 0.703962 | 3 | 0 | 3 |
| PI15 | SPRED1 | 0.702581 | 4 | 0 | 3 |
| PI15 | TNFAIP6 | 0.698013 | 6 | 0 | 5 |
| PI15 | EME1 | 0.689226 | 3 | 0 | 3 |
| PI15 | FAP | 0.681841 | 4 | 0 | 4 |
| PI15 | PRSS36 | 0.67902 | 3 | 0 | 3 |
| PI15 | AMPD3 | 0.677745 | 3 | 0 | 3 |
| PI15 | MIER2 | 0.677339 | 3 | 0 | 3 |
| PI15 | EPCAM | 0.674998 | 3 | 0 | 3 |
| PI15 | AKR1B1 | 0.674912 | 4 | 0 | 4 |
| PI15 | RHBDF2 | 0.674775 | 3 | 0 | 3 |
| PI15 | ZNF469 | 0.671388 | 5 | 0 | 5 |
For details and further investigation, click here