| Full name: perilipin 1 | Alias Symbol: | ||
| Type: protein-coding gene | Cytoband: 15q26.1 | ||
| Entrez ID: 5346 | HGNC ID: HGNC:9076 | Ensembl Gene: ENSG00000166819 | OMIM ID: 170290 |
PLIN1 involved pathways:
| KEGG pathway | Description | View |
|---|---|---|
| hsa03320 | PPAR signaling pathway | |
| hsa04923 | Regulation of lipolysis in adipocytes |
Expression of PLIN1:
| Dataset | Gene | EntrezID | Probe | Log2FC | Adj.pValue | Expression |
|---|---|---|---|---|---|---|
| GSE17351 | PLIN1 | 5346 | 205913_at | -0.3539 | 0.0856 | |
| GSE20347 | PLIN1 | 5346 | 205913_at | 0.0372 | 0.7501 | |
| GSE23400 | PLIN1 | 5346 | 205913_at | -0.1130 | 0.0022 | |
| GSE26886 | PLIN1 | 5346 | 205913_at | -0.2768 | 0.0180 | |
| GSE29001 | PLIN1 | 5346 | 205913_at | -0.2048 | 0.3801 | |
| GSE38129 | PLIN1 | 5346 | 205913_at | -0.5728 | 0.0768 | |
| GSE45670 | PLIN1 | 5346 | 205913_at | -0.0353 | 0.7221 | |
| GSE53622 | PLIN1 | 5346 | 123824 | -0.8432 | 0.0000 | |
| GSE53624 | PLIN1 | 5346 | 123824 | -0.7220 | 0.0000 | |
| GSE63941 | PLIN1 | 5346 | 205913_at | 0.1758 | 0.2811 | |
| GSE77861 | PLIN1 | 5346 | 205913_at | -0.0910 | 0.4278 | |
| GSE97050 | PLIN1 | 5346 | A_23_P26154 | 0.0291 | 0.9589 | |
| SRP133303 | PLIN1 | 5346 | RNAseq | -1.1633 | 0.0041 | |
| SRP159526 | PLIN1 | 5346 | RNAseq | -0.2164 | 0.6889 | |
| SRP219564 | PLIN1 | 5346 | RNAseq | 0.3300 | 0.6932 | |
| TCGA | PLIN1 | 5346 | RNAseq | -2.2228 | 0.0000 |
Upregulated datasets: 0; Downregulated datasets: 2.
Survival by PLIN1 expression:
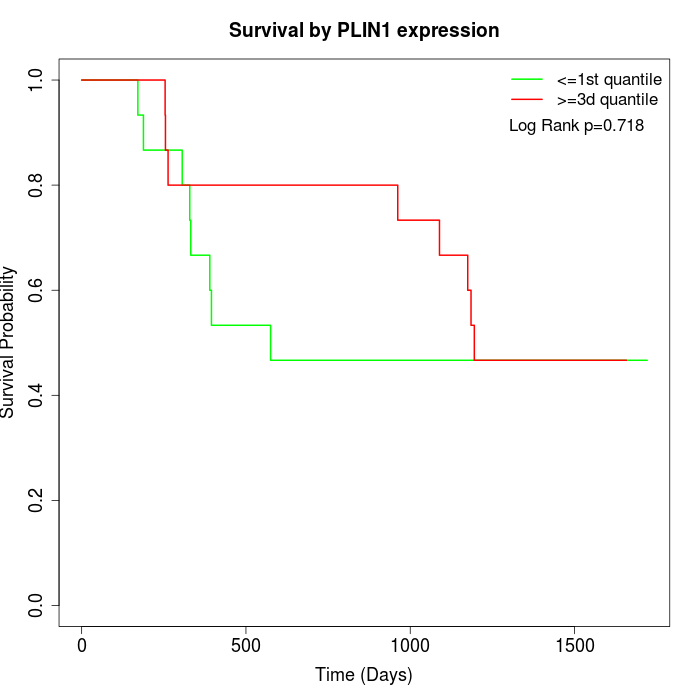 | 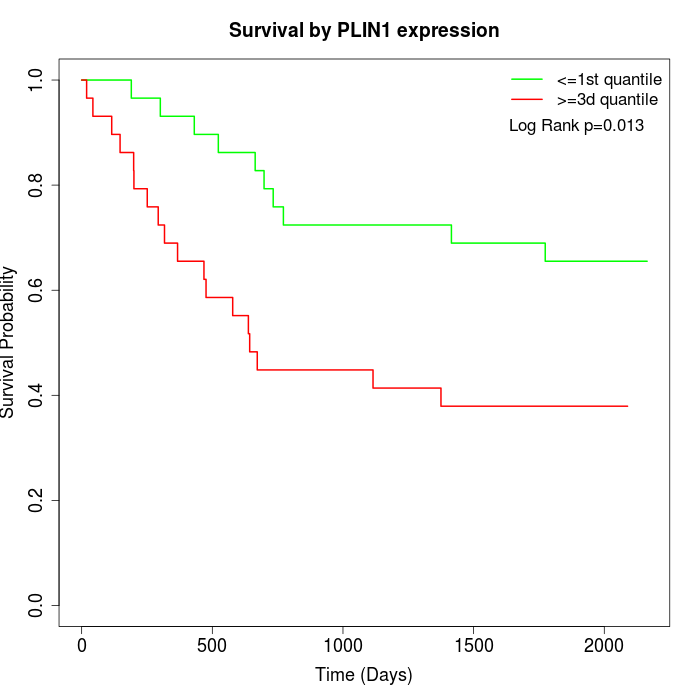 | 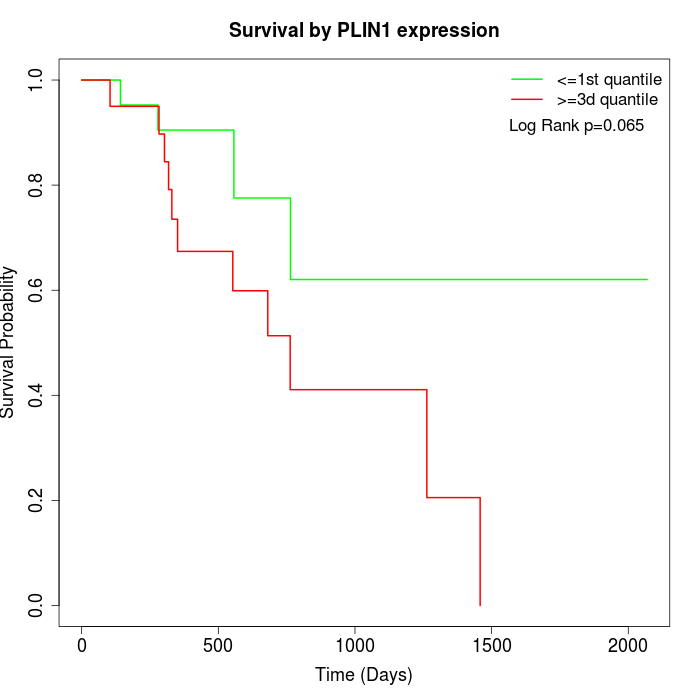 |
| GSE53622 | GSE53624 | TCGA |
Note: Click image to view full size file.
Copy number change of PLIN1:
| Dataset | Gene | EntrezID | Gain | Loss | Normal | Detail |
|---|---|---|---|---|---|---|
| GSE15526 | PLIN1 | 5346 | 8 | 2 | 20 | |
| GSE20123 | PLIN1 | 5346 | 8 | 2 | 20 | |
| GSE43470 | PLIN1 | 5346 | 5 | 4 | 34 | |
| GSE46452 | PLIN1 | 5346 | 3 | 7 | 49 | |
| GSE47630 | PLIN1 | 5346 | 8 | 11 | 21 | |
| GSE54993 | PLIN1 | 5346 | 4 | 6 | 60 | |
| GSE54994 | PLIN1 | 5346 | 7 | 6 | 40 | |
| GSE60625 | PLIN1 | 5346 | 4 | 0 | 7 | |
| GSE74703 | PLIN1 | 5346 | 4 | 3 | 29 | |
| GSE74704 | PLIN1 | 5346 | 4 | 2 | 14 | |
| TCGA | PLIN1 | 5346 | 17 | 12 | 67 |
Total number of gains: 72; Total number of losses: 55; Total Number of normals: 361.
Somatic mutations of PLIN1:
Generating mutation plots.
Highly correlated genes for PLIN1:
Showing top 20/359 corelated genes with mean PCC>0.5.
| Gene1 | Gene2 | Mean PCC | Num. Datasets | Num. PCC<0 | Num. PCC>0.5 |
|---|---|---|---|---|---|
| PLIN1 | SLC5A4 | 0.730885 | 3 | 0 | 3 |
| PLIN1 | CYP2A7 | 0.677727 | 5 | 0 | 5 |
| PLIN1 | TEK | 0.676699 | 6 | 0 | 5 |
| PLIN1 | ADAM18 | 0.674012 | 3 | 0 | 3 |
| PLIN1 | PIP | 0.671724 | 5 | 0 | 4 |
| PLIN1 | KRTAP5-8 | 0.670785 | 3 | 0 | 3 |
| PLIN1 | KCNE1 | 0.670595 | 3 | 0 | 3 |
| PLIN1 | ASIC2 | 0.669657 | 4 | 0 | 3 |
| PLIN1 | SLCO1C1 | 0.664871 | 4 | 0 | 4 |
| PLIN1 | CRIP2 | 0.663022 | 3 | 0 | 3 |
| PLIN1 | PLCD4 | 0.661752 | 3 | 0 | 3 |
| PLIN1 | FGF23 | 0.656637 | 4 | 0 | 4 |
| PLIN1 | CIITA | 0.656538 | 5 | 0 | 4 |
| PLIN1 | NEUROD2 | 0.654391 | 3 | 0 | 3 |
| PLIN1 | HOXB3 | 0.653779 | 3 | 0 | 3 |
| PLIN1 | IL1RAPL2 | 0.651554 | 4 | 0 | 3 |
| PLIN1 | HCRT | 0.650607 | 5 | 0 | 4 |
| PLIN1 | SOX17 | 0.648561 | 4 | 0 | 3 |
| PLIN1 | IFNA10 | 0.6481 | 5 | 0 | 4 |
| PLIN1 | CCR4 | 0.640897 | 4 | 0 | 3 |
For details and further investigation, click here