| Full name: PTTG1 regulator of sister chromatid separation, securin | Alias Symbol: PTTG|HPTTG|EAP1|securin | ||
| Type: protein-coding gene | Cytoband: 5q33.3 | ||
| Entrez ID: 9232 | HGNC ID: HGNC:9690 | Ensembl Gene: ENSG00000164611 | OMIM ID: 604147 |
Screen Evidence:
| |||
PTTG1 involved pathways:
| KEGG pathway | Description | View |
|---|---|---|
| hsa04110 | Cell cycle | |
| hsa04114 | Oocyte meiosis | |
| hsa05166 | HTLV-I infection |
Expression of PTTG1:
| Dataset | Gene | EntrezID | Probe | Log2FC | Adj.pValue | Expression |
|---|---|---|---|---|---|---|
| GSE17351 | PTTG1 | 9232 | 203554_x_at | 0.6335 | 0.1717 | |
| GSE20347 | PTTG1 | 9232 | 203554_x_at | 0.5751 | 0.0060 | |
| GSE23400 | PTTG1 | 9232 | 203554_x_at | 0.8025 | 0.0000 | |
| GSE26886 | PTTG1 | 9232 | 203554_x_at | 0.6842 | 0.0003 | |
| GSE29001 | PTTG1 | 9232 | 203554_x_at | 0.5533 | 0.1462 | |
| GSE38129 | PTTG1 | 9232 | 203554_x_at | 1.1860 | 0.0000 | |
| GSE45670 | PTTG1 | 9232 | 203554_x_at | 0.7389 | 0.0007 | |
| GSE53622 | PTTG1 | 9232 | 118962 | 0.6855 | 0.0000 | |
| GSE53624 | PTTG1 | 9232 | 118962 | 1.1024 | 0.0000 | |
| GSE63941 | PTTG1 | 9232 | 203554_x_at | 2.9813 | 0.0004 | |
| GSE77861 | PTTG1 | 9232 | 203554_x_at | 0.4044 | 0.0627 | |
| GSE97050 | PTTG1 | 9232 | A_23_P7636 | 1.2573 | 0.1456 | |
| SRP007169 | PTTG1 | 9232 | RNAseq | 0.9276 | 0.1209 | |
| SRP064894 | PTTG1 | 9232 | RNAseq | 0.9940 | 0.0022 | |
| SRP133303 | PTTG1 | 9232 | RNAseq | 1.0663 | 0.0007 | |
| SRP159526 | PTTG1 | 9232 | RNAseq | 0.3928 | 0.1059 | |
| SRP193095 | PTTG1 | 9232 | RNAseq | 0.0787 | 0.6965 | |
| SRP219564 | PTTG1 | 9232 | RNAseq | 0.4965 | 0.5402 | |
| TCGA | PTTG1 | 9232 | RNAseq | 1.2140 | 0.0000 |
Upregulated datasets: 5; Downregulated datasets: 0.
Survival by PTTG1 expression:
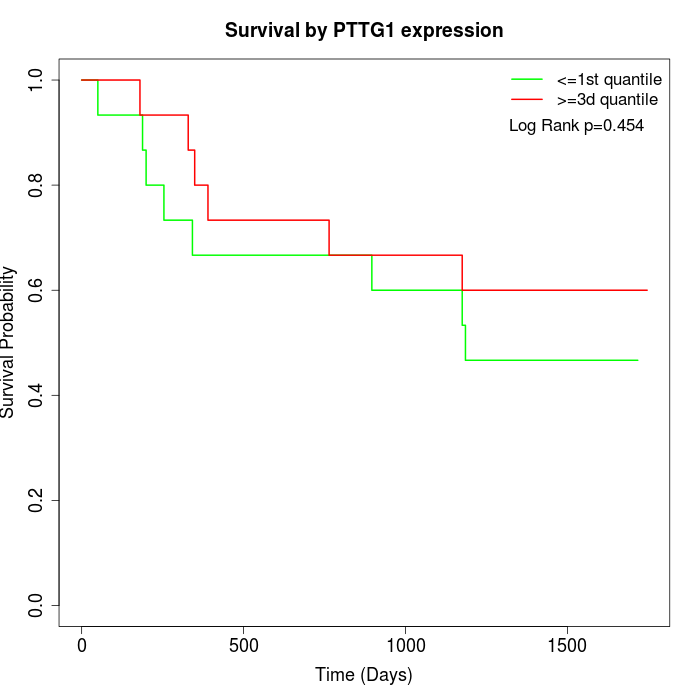 | 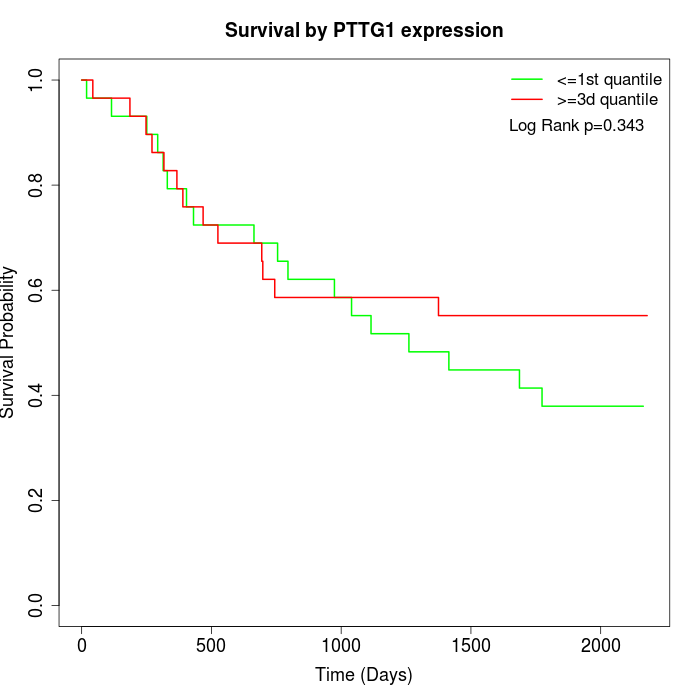 | 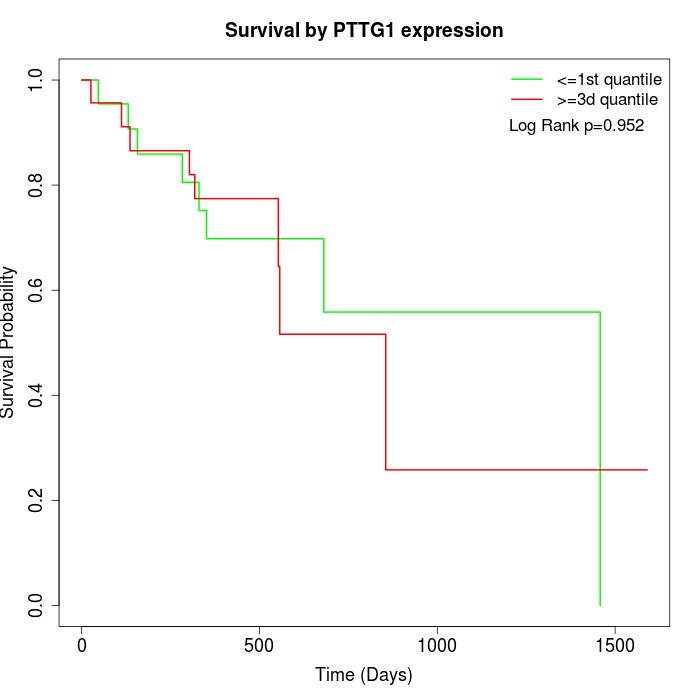 |
| GSE53622 | GSE53624 | TCGA |
Note: Click image to view full size file.
Copy number change of PTTG1:
| Dataset | Gene | EntrezID | Gain | Loss | Normal | Detail |
|---|---|---|---|---|---|---|
| GSE15526 | PTTG1 | 9232 | 0 | 11 | 19 | |
| GSE20123 | PTTG1 | 9232 | 0 | 11 | 19 | |
| GSE43470 | PTTG1 | 9232 | 2 | 10 | 31 | |
| GSE46452 | PTTG1 | 9232 | 0 | 27 | 32 | |
| GSE47630 | PTTG1 | 9232 | 0 | 20 | 20 | |
| GSE54993 | PTTG1 | 9232 | 9 | 2 | 59 | |
| GSE54994 | PTTG1 | 9232 | 1 | 16 | 36 | |
| GSE60625 | PTTG1 | 9232 | 0 | 0 | 11 | |
| GSE74703 | PTTG1 | 9232 | 2 | 8 | 26 | |
| GSE74704 | PTTG1 | 9232 | 0 | 6 | 14 | |
| TCGA | PTTG1 | 9232 | 5 | 36 | 55 |
Total number of gains: 19; Total number of losses: 147; Total Number of normals: 322.
Somatic mutations of PTTG1:
Generating mutation plots.
Highly correlated genes for PTTG1:
Showing top 20/1186 corelated genes with mean PCC>0.5.
| Gene1 | Gene2 | Mean PCC | Num. Datasets | Num. PCC<0 | Num. PCC>0.5 |
|---|---|---|---|---|---|
| PTTG1 | HMMR | 0.754589 | 13 | 0 | 13 |
| PTTG1 | RNASEH2A | 0.749265 | 11 | 0 | 11 |
| PTTG1 | TPX2 | 0.742242 | 12 | 0 | 12 |
| PTTG1 | CCNB2 | 0.731641 | 13 | 0 | 12 |
| PTTG1 | KIF20A | 0.727321 | 13 | 0 | 12 |
| PTTG1 | CENPF | 0.726876 | 12 | 0 | 12 |
| PTTG1 | KIF4A | 0.726693 | 11 | 0 | 11 |
| PTTG1 | FANCD2 | 0.724859 | 5 | 0 | 5 |
| PTTG1 | CENPK | 0.718221 | 7 | 0 | 7 |
| PTTG1 | AURKB | 0.717922 | 13 | 0 | 12 |
| PTTG1 | UBE2T | 0.717397 | 8 | 0 | 8 |
| PTTG1 | CKS1B | 0.716703 | 12 | 0 | 12 |
| PTTG1 | CDK1 | 0.71454 | 12 | 0 | 11 |
| PTTG1 | PPP1R14C | 0.714088 | 7 | 0 | 6 |
| PTTG1 | NUF2 | 0.712312 | 8 | 0 | 8 |
| PTTG1 | TOP2A | 0.70768 | 13 | 0 | 11 |
| PTTG1 | UBE2C | 0.706378 | 13 | 0 | 12 |
| PTTG1 | MELK | 0.702457 | 11 | 0 | 10 |
| PTTG1 | CCNB1 | 0.701727 | 13 | 0 | 10 |
| PTTG1 | CDKN3 | 0.701499 | 13 | 0 | 12 |
For details and further investigation, click here