| Full name: Ras like without CAAX 1 | Alias Symbol: RIBB|ROC1|MGC125864|MGC125865 | ||
| Type: protein-coding gene | Cytoband: 1q22 | ||
| Entrez ID: 6016 | HGNC ID: HGNC:10023 | Ensembl Gene: ENSG00000143622 | OMIM ID: 609591 |
| Related drugs: PICTILISIB, SELUMETINIB... [more] | |||
Screen Evidence:
| |||
Expression of RIT1:
| Dataset | Gene | EntrezID | Probe | Log2FC | Adj.pValue | Expression |
|---|---|---|---|---|---|---|
| GSE17351 | RIT1 | 6016 | 209882_at | -0.2347 | 0.8012 | |
| GSE20347 | RIT1 | 6016 | 209882_at | -0.7742 | 0.0065 | |
| GSE23400 | RIT1 | 6016 | 209882_at | -0.3483 | 0.0149 | |
| GSE26886 | RIT1 | 6016 | 236224_at | -1.1698 | 0.0218 | |
| GSE29001 | RIT1 | 6016 | 209882_at | -0.9227 | 0.0843 | |
| GSE38129 | RIT1 | 6016 | 209882_at | -0.0977 | 0.7946 | |
| GSE45670 | RIT1 | 6016 | 209882_at | -0.0280 | 0.9289 | |
| GSE53622 | RIT1 | 6016 | 23439 | 0.2418 | 0.0161 | |
| GSE53624 | RIT1 | 6016 | 23439 | -0.0698 | 0.4670 | |
| GSE63941 | RIT1 | 6016 | 209882_at | -0.0201 | 0.9789 | |
| GSE77861 | RIT1 | 6016 | 209882_at | -0.2961 | 0.4171 | |
| GSE97050 | RIT1 | 6016 | A_33_P3394075 | -0.0338 | 0.9163 | |
| SRP007169 | RIT1 | 6016 | RNAseq | -0.6305 | 0.1901 | |
| SRP008496 | RIT1 | 6016 | RNAseq | -0.0328 | 0.9314 | |
| SRP064894 | RIT1 | 6016 | RNAseq | -0.8952 | 0.0000 | |
| SRP133303 | RIT1 | 6016 | RNAseq | -0.2105 | 0.2981 | |
| SRP159526 | RIT1 | 6016 | RNAseq | 0.4248 | 0.3421 | |
| SRP193095 | RIT1 | 6016 | RNAseq | -0.4679 | 0.0224 | |
| SRP219564 | RIT1 | 6016 | RNAseq | -0.7976 | 0.1048 | |
| TCGA | RIT1 | 6016 | RNAseq | 0.1064 | 0.1998 |
Upregulated datasets: 0; Downregulated datasets: 1.
Survival by RIT1 expression:
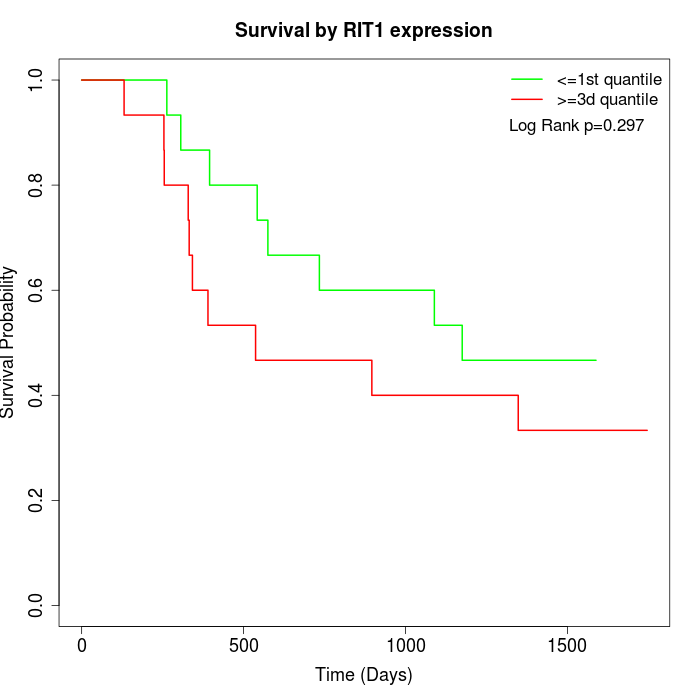 | 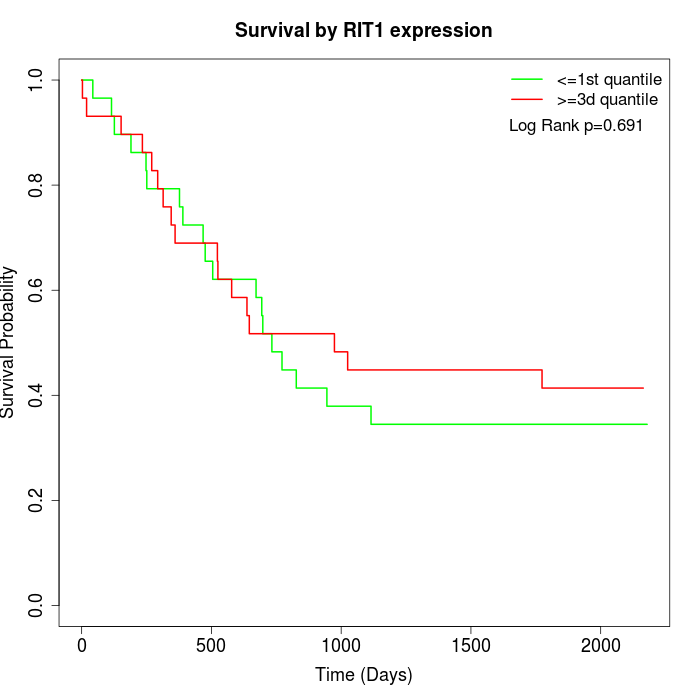 | 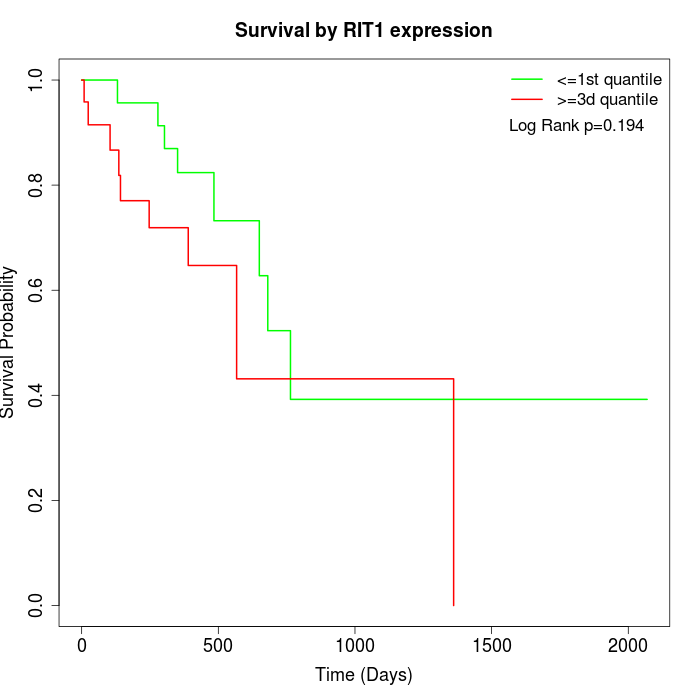 |
| GSE53622 | GSE53624 | TCGA |
Note: Click image to view full size file.
Copy number change of RIT1:
| Dataset | Gene | EntrezID | Gain | Loss | Normal | Detail |
|---|---|---|---|---|---|---|
| GSE15526 | RIT1 | 6016 | 14 | 0 | 16 | |
| GSE20123 | RIT1 | 6016 | 13 | 0 | 17 | |
| GSE43470 | RIT1 | 6016 | 7 | 2 | 34 | |
| GSE46452 | RIT1 | 6016 | 2 | 1 | 56 | |
| GSE47630 | RIT1 | 6016 | 14 | 0 | 26 | |
| GSE54993 | RIT1 | 6016 | 0 | 5 | 65 | |
| GSE54994 | RIT1 | 6016 | 16 | 0 | 37 | |
| GSE60625 | RIT1 | 6016 | 0 | 0 | 11 | |
| GSE74703 | RIT1 | 6016 | 7 | 2 | 27 | |
| GSE74704 | RIT1 | 6016 | 6 | 0 | 14 | |
| TCGA | RIT1 | 6016 | 38 | 2 | 56 |
Total number of gains: 117; Total number of losses: 12; Total Number of normals: 359.
Somatic mutations of RIT1:
Generating mutation plots.
Highly correlated genes for RIT1:
Showing top 20/145 corelated genes with mean PCC>0.5.
| Gene1 | Gene2 | Mean PCC | Num. Datasets | Num. PCC<0 | Num. PCC>0.5 |
|---|---|---|---|---|---|
| RIT1 | TP53INP1 | 0.76092 | 3 | 0 | 3 |
| RIT1 | PHLDB3 | 0.733207 | 4 | 0 | 4 |
| RIT1 | CARD6 | 0.704594 | 3 | 0 | 3 |
| RIT1 | TAF1B | 0.680872 | 3 | 0 | 3 |
| RIT1 | PGD | 0.652914 | 10 | 0 | 10 |
| RIT1 | MUC15 | 0.646636 | 3 | 0 | 3 |
| RIT1 | DAPL1 | 0.640457 | 3 | 0 | 3 |
| RIT1 | KRT36 | 0.632485 | 3 | 0 | 3 |
| RIT1 | NAMPT | 0.631247 | 9 | 0 | 8 |
| RIT1 | GJB2 | 0.629293 | 3 | 0 | 3 |
| RIT1 | CDRT1 | 0.623527 | 4 | 0 | 3 |
| RIT1 | ZNF780A | 0.622099 | 4 | 0 | 3 |
| RIT1 | HEBP1 | 0.616858 | 4 | 0 | 3 |
| RIT1 | TRIM16 | 0.608017 | 10 | 0 | 7 |
| RIT1 | SC5D | 0.605295 | 7 | 0 | 5 |
| RIT1 | CYP4F3 | 0.604874 | 11 | 0 | 10 |
| RIT1 | DNASE1 | 0.603432 | 4 | 0 | 3 |
| RIT1 | ME1 | 0.6012 | 10 | 0 | 7 |
| RIT1 | PCDH1 | 0.60084 | 5 | 0 | 3 |
| RIT1 | ADK | 0.598052 | 6 | 0 | 4 |
For details and further investigation, click here