| Full name: S100 calcium binding protein A10 | Alias Symbol: P11|42C|CLP11 | ||
| Type: protein-coding gene | Cytoband: 1q21.3 | ||
| Entrez ID: 6281 | HGNC ID: HGNC:10487 | Ensembl Gene: ENSG00000197747 | OMIM ID: 114085 |
| Drug and gene relationship at DGIdb | |||
Screen Evidence:
| |||
Expression of S100A10:
| Dataset | Gene | EntrezID | Probe | Log2FC | Adj.pValue | Expression |
|---|---|---|---|---|---|---|
| GSE17351 | S100A10 | 6281 | 200872_at | -0.6533 | 0.3168 | |
| GSE20347 | S100A10 | 6281 | 200872_at | -1.2820 | 0.0000 | |
| GSE23400 | S100A10 | 6281 | 200872_at | -0.7698 | 0.0000 | |
| GSE26886 | S100A10 | 6281 | 200872_at | -0.4951 | 0.0048 | |
| GSE29001 | S100A10 | 6281 | 200872_at | -0.8303 | 0.0081 | |
| GSE38129 | S100A10 | 6281 | 200872_at | -0.7637 | 0.0008 | |
| GSE45670 | S100A10 | 6281 | 200872_at | -0.3023 | 0.0608 | |
| GSE53622 | S100A10 | 6281 | 10411 | -0.9366 | 0.0000 | |
| GSE53624 | S100A10 | 6281 | 70446 | -0.9846 | 0.0000 | |
| GSE63941 | S100A10 | 6281 | 200872_at | 0.9180 | 0.0546 | |
| GSE77861 | S100A10 | 6281 | 200872_at | -0.3538 | 0.1800 | |
| GSE97050 | S100A10 | 6281 | A_23_P137984 | -0.4913 | 0.3930 | |
| SRP007169 | S100A10 | 6281 | RNAseq | -2.5116 | 0.0000 | |
| SRP008496 | S100A10 | 6281 | RNAseq | -2.1070 | 0.0000 | |
| SRP064894 | S100A10 | 6281 | RNAseq | -1.3110 | 0.0000 | |
| SRP133303 | S100A10 | 6281 | RNAseq | -0.8196 | 0.0068 | |
| SRP159526 | S100A10 | 6281 | RNAseq | -1.5068 | 0.0000 | |
| SRP193095 | S100A10 | 6281 | RNAseq | -1.3164 | 0.0000 | |
| SRP219564 | S100A10 | 6281 | RNAseq | -0.8872 | 0.0928 | |
| TCGA | S100A10 | 6281 | RNAseq | 0.2466 | 0.0057 |
Upregulated datasets: 0; Downregulated datasets: 6.
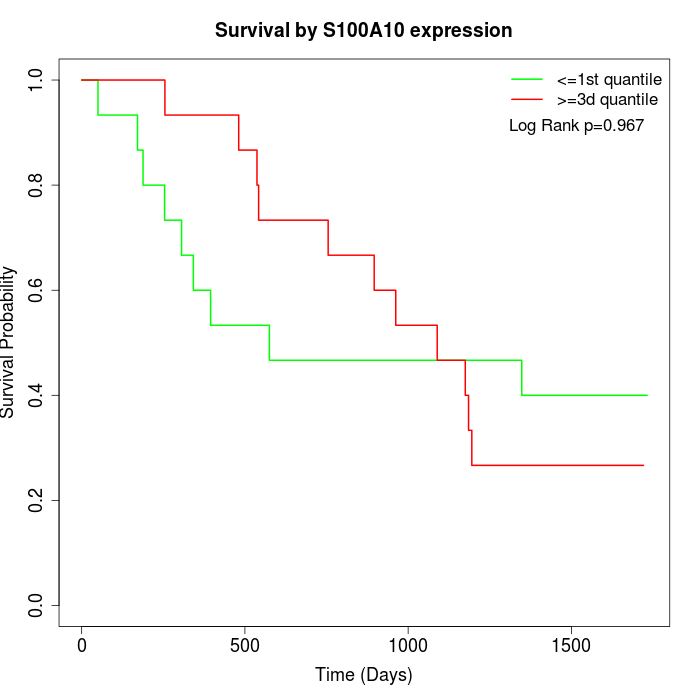
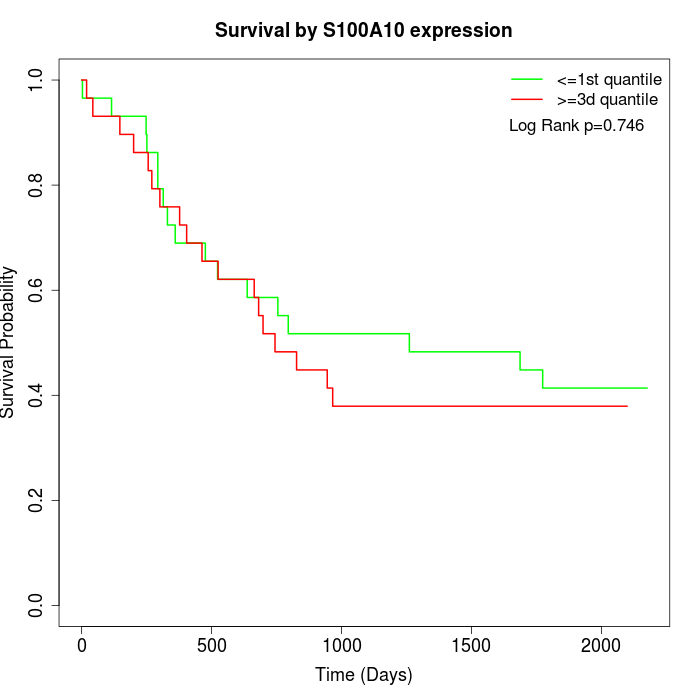
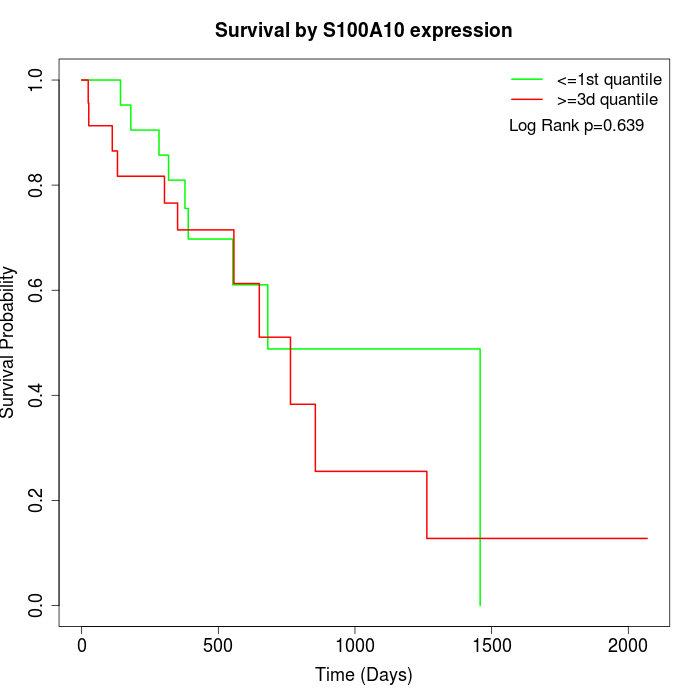
Survival by S100A10 expression:
Note: Click image to view full size file.
Copy number change of S100A10:
| Dataset | Gene | EntrezID | Gain | Loss | Normal | Detail |
|---|---|---|---|---|---|---|
| GSE15526 | S100A10 | 6281 | 15 | 0 | 15 | |
| GSE20123 | S100A10 | 6281 | 15 | 0 | 15 | |
| GSE43470 | S100A10 | 6281 | 6 | 2 | 35 | |
| GSE46452 | S100A10 | 6281 | 2 | 1 | 56 | |
| GSE47630 | S100A10 | 6281 | 15 | 0 | 25 | |
| GSE54993 | S100A10 | 6281 | 0 | 4 | 66 | |
| GSE54994 | S100A10 | 6281 | 15 | 0 | 38 | |
| GSE60625 | S100A10 | 6281 | 0 | 0 | 11 | |
| GSE74703 | S100A10 | 6281 | 6 | 1 | 29 | |
| GSE74704 | S100A10 | 6281 | 7 | 0 | 13 | |
| TCGA | S100A10 | 6281 | 39 | 2 | 55 |
Total number of gains: 120; Total number of losses: 10; Total Number of normals: 358.
Somatic mutations of S100A10:
Generating mutation plots.
Highly correlated genes for S100A10:
Showing top 20/953 corelated genes with mean PCC>0.5.
| Gene1 | Gene2 | Mean PCC | Num. Datasets | Num. PCC<0 | Num. PCC>0.5 |
|---|---|---|---|---|---|
| S100A10 | KRT83 | 0.812427 | 4 | 0 | 4 |
| S100A10 | NCCRP1 | 0.788639 | 3 | 0 | 3 |
| S100A10 | ANXA2 | 0.765779 | 13 | 0 | 12 |
| S100A10 | ANXA1 | 0.762474 | 11 | 0 | 10 |
| S100A10 | IL18 | 0.746843 | 11 | 0 | 10 |
| S100A10 | EMP1 | 0.746683 | 10 | 0 | 10 |
| S100A10 | ECM1 | 0.744573 | 11 | 0 | 10 |
| S100A10 | SH3GL1 | 0.737514 | 10 | 0 | 10 |
| S100A10 | SERPINB1 | 0.735219 | 11 | 0 | 10 |
| S100A10 | S100A14 | 0.734975 | 11 | 0 | 10 |
| S100A10 | C3orf20 | 0.734882 | 4 | 0 | 4 |
| S100A10 | TMOD3 | 0.734184 | 11 | 0 | 10 |
| S100A10 | TUBB6 | 0.732965 | 11 | 0 | 10 |
| S100A10 | KPRP | 0.731291 | 3 | 0 | 3 |
| S100A10 | RABGGTA | 0.730992 | 8 | 0 | 8 |
| S100A10 | HES5 | 0.730099 | 4 | 0 | 4 |
| S100A10 | S100A16 | 0.729382 | 8 | 0 | 7 |
| S100A10 | DSG3 | 0.727702 | 10 | 0 | 9 |
| S100A10 | UPP1 | 0.727377 | 12 | 0 | 10 |
| S100A10 | IL1RN | 0.726922 | 11 | 0 | 10 |
For details and further investigation, click here


