| Full name: SET domain bifurcated histone lysine methyltransferase 1 | Alias Symbol: KG1T|KIAA0067|ESET|KMT1E|TDRD21 | ||
| Type: protein-coding gene | Cytoband: 1q21.3 | ||
| Entrez ID: 9869 | HGNC ID: HGNC:10761 | Ensembl Gene: ENSG00000143379 | OMIM ID: 604396 |
Screen Evidence:
| |||
Expression of SETDB1:
| Dataset | Gene | EntrezID | Probe | Log2FC | Adj.pValue | Expression |
|---|---|---|---|---|---|---|
| GSE17351 | SETDB1 | 9869 | 203155_at | 0.5633 | 0.1398 | |
| GSE20347 | SETDB1 | 9869 | 203155_at | 0.3193 | 0.0010 | |
| GSE23400 | SETDB1 | 9869 | 203155_at | 0.2764 | 0.0000 | |
| GSE26886 | SETDB1 | 9869 | 203155_at | 0.2343 | 0.4082 | |
| GSE29001 | SETDB1 | 9869 | 203155_at | 0.3711 | 0.0556 | |
| GSE38129 | SETDB1 | 9869 | 203155_at | 0.4614 | 0.0000 | |
| GSE45670 | SETDB1 | 9869 | 203155_at | 0.2161 | 0.1511 | |
| GSE53622 | SETDB1 | 9869 | 45793 | 0.2757 | 0.0000 | |
| GSE53624 | SETDB1 | 9869 | 110041 | 0.1887 | 0.0003 | |
| GSE63941 | SETDB1 | 9869 | 203155_at | 0.4768 | 0.1674 | |
| GSE77861 | SETDB1 | 9869 | 203155_at | 0.4092 | 0.1142 | |
| GSE97050 | SETDB1 | 9869 | A_33_P3305399 | 0.1347 | 0.4764 | |
| SRP007169 | SETDB1 | 9869 | RNAseq | 0.5444 | 0.1359 | |
| SRP008496 | SETDB1 | 9869 | RNAseq | 0.7294 | 0.0236 | |
| SRP064894 | SETDB1 | 9869 | RNAseq | 0.2545 | 0.0325 | |
| SRP133303 | SETDB1 | 9869 | RNAseq | 0.0306 | 0.8431 | |
| SRP159526 | SETDB1 | 9869 | RNAseq | 0.6925 | 0.0092 | |
| SRP193095 | SETDB1 | 9869 | RNAseq | 0.5406 | 0.0000 | |
| SRP219564 | SETDB1 | 9869 | RNAseq | 0.4147 | 0.3066 | |
| TCGA | SETDB1 | 9869 | RNAseq | 0.0741 | 0.1468 |
Upregulated datasets: 0; Downregulated datasets: 0.
Survival by SETDB1 expression:
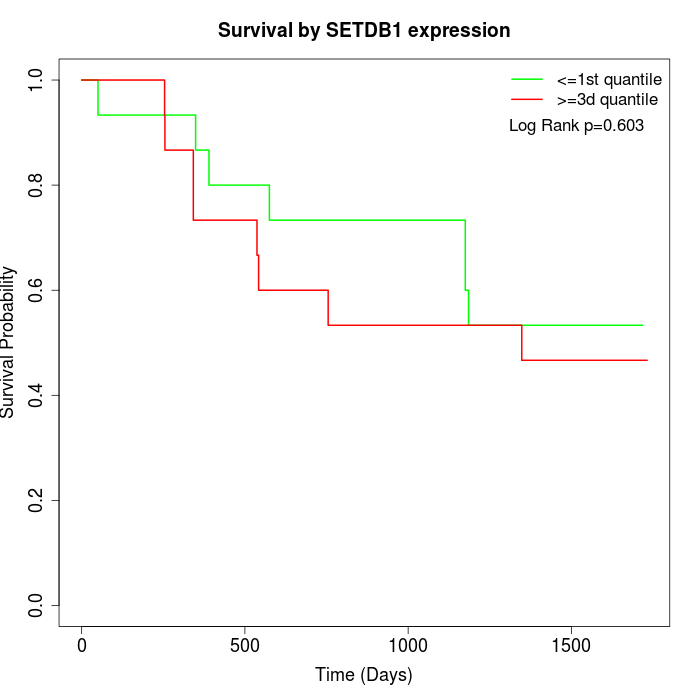 | 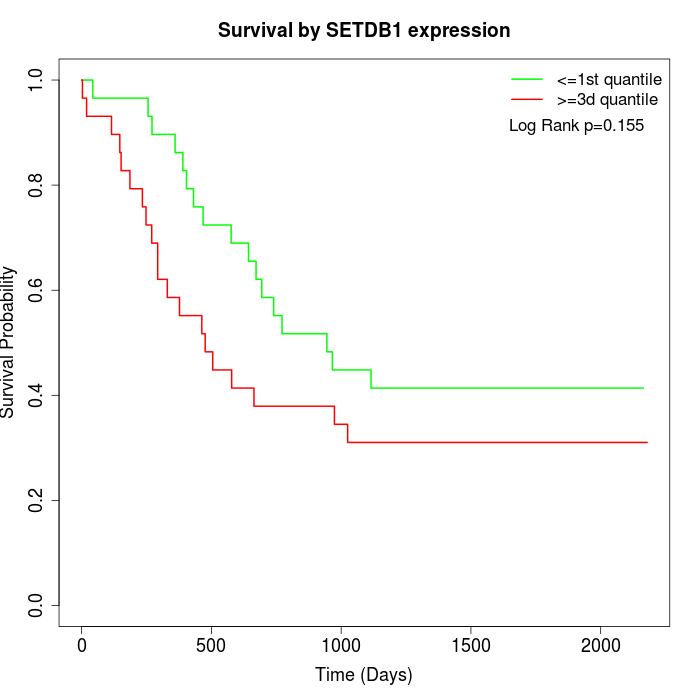 | 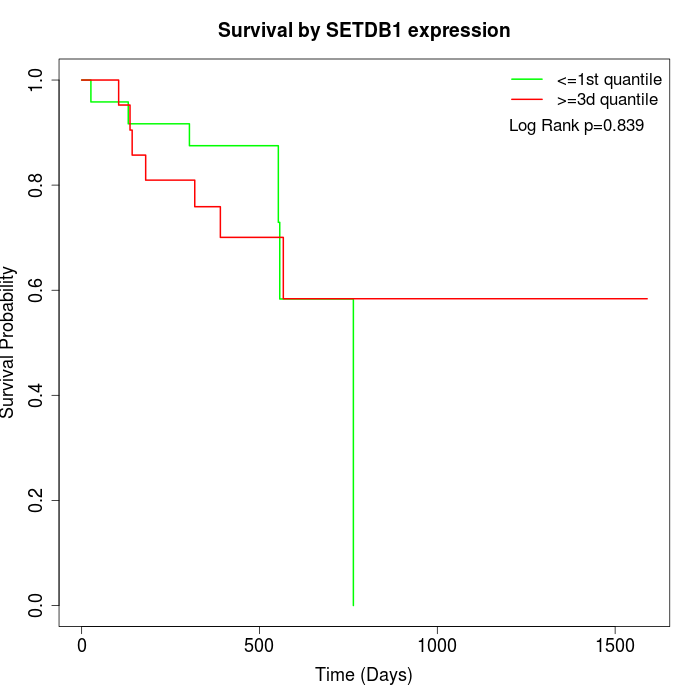 |
| GSE53622 | GSE53624 | TCGA |
Note: Click image to view full size file.
Copy number change of SETDB1:
| Dataset | Gene | EntrezID | Gain | Loss | Normal | Detail |
|---|---|---|---|---|---|---|
| GSE15526 | SETDB1 | 9869 | 15 | 0 | 15 | |
| GSE20123 | SETDB1 | 9869 | 15 | 0 | 15 | |
| GSE43470 | SETDB1 | 9869 | 6 | 1 | 36 | |
| GSE46452 | SETDB1 | 9869 | 2 | 1 | 56 | |
| GSE47630 | SETDB1 | 9869 | 14 | 0 | 26 | |
| GSE54993 | SETDB1 | 9869 | 0 | 4 | 66 | |
| GSE54994 | SETDB1 | 9869 | 15 | 0 | 38 | |
| GSE60625 | SETDB1 | 9869 | 0 | 0 | 11 | |
| GSE74703 | SETDB1 | 9869 | 6 | 1 | 29 | |
| GSE74704 | SETDB1 | 9869 | 7 | 0 | 13 | |
| TCGA | SETDB1 | 9869 | 37 | 2 | 57 |
Total number of gains: 117; Total number of losses: 9; Total Number of normals: 362.
Somatic mutations of SETDB1:
Generating mutation plots.
Highly correlated genes for SETDB1:
Showing top 20/753 corelated genes with mean PCC>0.5.
| Gene1 | Gene2 | Mean PCC | Num. Datasets | Num. PCC<0 | Num. PCC>0.5 |
|---|---|---|---|---|---|
| SETDB1 | PDCD2L | 0.791853 | 4 | 0 | 4 |
| SETDB1 | PPP1R16A | 0.723567 | 3 | 0 | 3 |
| SETDB1 | CCM2 | 0.722302 | 3 | 0 | 3 |
| SETDB1 | RNF217 | 0.714203 | 3 | 0 | 3 |
| SETDB1 | TULP4 | 0.705837 | 4 | 0 | 3 |
| SETDB1 | PCDH17 | 0.701336 | 3 | 0 | 3 |
| SETDB1 | TOP1MT | 0.680447 | 4 | 0 | 3 |
| SETDB1 | FADS3 | 0.678475 | 3 | 0 | 3 |
| SETDB1 | SFXN2 | 0.676584 | 3 | 0 | 3 |
| SETDB1 | C12orf73 | 0.676135 | 3 | 0 | 3 |
| SETDB1 | UHMK1 | 0.673106 | 4 | 0 | 4 |
| SETDB1 | PTPRJ | 0.671393 | 3 | 0 | 3 |
| SETDB1 | NACC1 | 0.671102 | 3 | 0 | 3 |
| SETDB1 | CRCP | 0.669178 | 3 | 0 | 3 |
| SETDB1 | GRAMD4 | 0.667962 | 3 | 0 | 3 |
| SETDB1 | CLK2 | 0.667757 | 13 | 0 | 12 |
| SETDB1 | GPR158 | 0.662443 | 3 | 0 | 3 |
| SETDB1 | C12orf45 | 0.660684 | 4 | 0 | 3 |
| SETDB1 | MMS19 | 0.657962 | 3 | 0 | 3 |
| SETDB1 | CHD6 | 0.655996 | 4 | 0 | 3 |
For details and further investigation, click here