| Full name: spindle and kinetochore associated complex subunit 3 | Alias Symbol: MGC4832|RAMA1 | ||
| Type: protein-coding gene | Cytoband: 13q12.11 | ||
| Entrez ID: 221150 | HGNC ID: HGNC:20262 | Ensembl Gene: ENSG00000165480 | OMIM ID: |
Screen Evidence:
| |||
Expression of SKA3:
| Dataset | Gene | EntrezID | Probe | Log2FC | Adj.pValue | Expression |
|---|---|---|---|---|---|---|
| GSE17351 | SKA3 | 221150 | 227165_at | 0.7715 | 0.2423 | |
| GSE26886 | SKA3 | 221150 | 227165_at | -0.0175 | 0.9363 | |
| GSE45670 | SKA3 | 221150 | 227165_at | 0.8439 | 0.0000 | |
| GSE53622 | SKA3 | 221150 | 66820 | 0.7636 | 0.0000 | |
| GSE53624 | SKA3 | 221150 | 66820 | 1.3749 | 0.0000 | |
| GSE63941 | SKA3 | 221150 | 227165_at | 1.7420 | 0.0044 | |
| GSE77861 | SKA3 | 221150 | 227165_at | 0.2166 | 0.1635 | |
| GSE97050 | SKA3 | 221150 | A_33_P3216008 | 0.5041 | 0.2193 | |
| SRP007169 | SKA3 | 221150 | RNAseq | 0.5049 | 0.2980 | |
| SRP064894 | SKA3 | 221150 | RNAseq | 1.3487 | 0.0001 | |
| SRP133303 | SKA3 | 221150 | RNAseq | 1.2755 | 0.0000 | |
| SRP159526 | SKA3 | 221150 | RNAseq | 0.8382 | 0.0009 | |
| SRP193095 | SKA3 | 221150 | RNAseq | 0.4309 | 0.0188 | |
| SRP219564 | SKA3 | 221150 | RNAseq | 1.1400 | 0.1325 | |
| TCGA | SKA3 | 221150 | RNAseq | 1.2959 | 0.0000 |
Upregulated datasets: 5; Downregulated datasets: 0.
Survival by SKA3 expression:
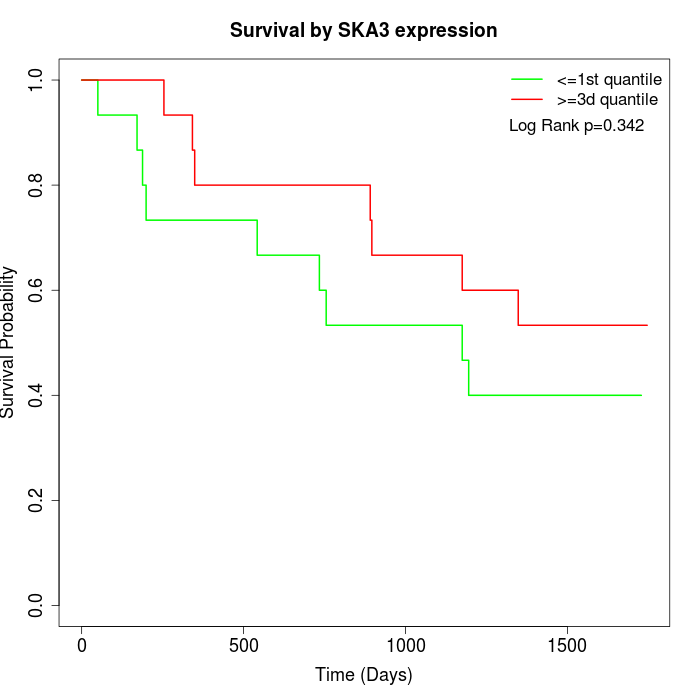 | 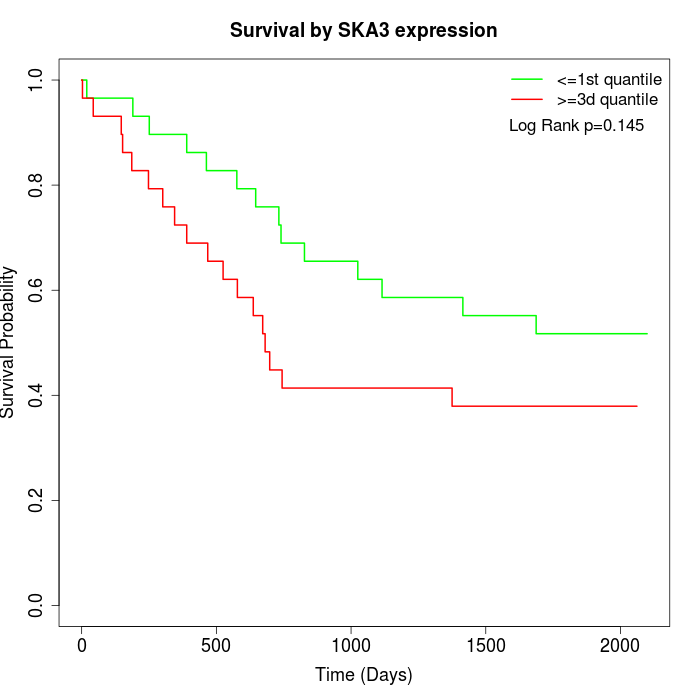 |  |
| GSE53622 | GSE53624 | TCGA |
Note: Click image to view full size file.
Copy number change of SKA3:
| Dataset | Gene | EntrezID | Gain | Loss | Normal | Detail |
|---|---|---|---|---|---|---|
| GSE15526 | SKA3 | 221150 | 1 | 14 | 15 | |
| GSE20123 | SKA3 | 221150 | 1 | 13 | 16 | |
| GSE43470 | SKA3 | 221150 | 2 | 13 | 28 | |
| GSE46452 | SKA3 | 221150 | 0 | 33 | 26 | |
| GSE47630 | SKA3 | 221150 | 3 | 26 | 11 | |
| GSE54993 | SKA3 | 221150 | 11 | 2 | 57 | |
| GSE54994 | SKA3 | 221150 | 1 | 13 | 39 | |
| GSE60625 | SKA3 | 221150 | 0 | 3 | 8 | |
| GSE74703 | SKA3 | 221150 | 2 | 10 | 24 | |
| GSE74704 | SKA3 | 221150 | 0 | 11 | 9 | |
| TCGA | SKA3 | 221150 | 6 | 43 | 47 |
Total number of gains: 27; Total number of losses: 181; Total Number of normals: 280.
Somatic mutations of SKA3:
Generating mutation plots.
Highly correlated genes for SKA3:
Showing top 20/1506 corelated genes with mean PCC>0.5.
| Gene1 | Gene2 | Mean PCC | Num. Datasets | Num. PCC<0 | Num. PCC>0.5 |
|---|---|---|---|---|---|
| SKA3 | EXO1 | 0.821563 | 6 | 0 | 6 |
| SKA3 | CDT1 | 0.808914 | 7 | 0 | 7 |
| SKA3 | C1orf112 | 0.798033 | 5 | 0 | 5 |
| SKA3 | HJURP | 0.797123 | 8 | 0 | 8 |
| SKA3 | CEP55 | 0.795432 | 8 | 0 | 8 |
| SKA3 | KIFC1 | 0.791372 | 7 | 0 | 7 |
| SKA3 | UBE2T | 0.780404 | 7 | 0 | 7 |
| SKA3 | MELK | 0.77643 | 8 | 0 | 8 |
| SKA3 | PRC1 | 0.77627 | 8 | 0 | 8 |
| SKA3 | NDC80 | 0.775796 | 7 | 0 | 7 |
| SKA3 | NEK2 | 0.774764 | 8 | 0 | 8 |
| SKA3 | CENPA | 0.773623 | 7 | 0 | 7 |
| SKA3 | CENPW | 0.77223 | 6 | 0 | 6 |
| SKA3 | KNSTRN | 0.770122 | 6 | 0 | 6 |
| SKA3 | BIRC5 | 0.769792 | 8 | 0 | 8 |
| SKA3 | FANCI | 0.767663 | 7 | 0 | 7 |
| SKA3 | NUSAP1 | 0.765487 | 8 | 0 | 8 |
| SKA3 | KIF2C | 0.759708 | 7 | 0 | 7 |
| SKA3 | KIF11 | 0.7592 | 8 | 0 | 8 |
| SKA3 | DKC1 | 0.755585 | 3 | 0 | 3 |
For details and further investigation, click here