| Full name: serine palmitoyltransferase long chain base subunit 3 | Alias Symbol: LCB2B|FLJ11112|hLCB2b | ||
| Type: protein-coding gene | Cytoband: 20p12.1 | ||
| Entrez ID: 55304 | HGNC ID: HGNC:16253 | Ensembl Gene: ENSG00000172296 | OMIM ID: 611120 |
| Related drugs: MYRIOCIN... [more] | |||
Expression of SPTLC3:
| Dataset | Gene | EntrezID | Probe | Log2FC | Adj.pValue | Expression |
|---|---|---|---|---|---|---|
| GSE17351 | SPTLC3 | 55304 | 227752_at | -0.4618 | 0.6914 | |
| GSE20347 | SPTLC3 | 55304 | 220456_at | 0.0896 | 0.2964 | |
| GSE23400 | SPTLC3 | 55304 | 220456_at | -0.0394 | 0.0318 | |
| GSE26886 | SPTLC3 | 55304 | 227752_at | -1.2109 | 0.0000 | |
| GSE29001 | SPTLC3 | 55304 | 220456_at | -0.0819 | 0.7921 | |
| GSE38129 | SPTLC3 | 55304 | 220456_at | -0.0216 | 0.8325 | |
| GSE45670 | SPTLC3 | 55304 | 227752_at | -0.8006 | 0.0359 | |
| GSE53622 | SPTLC3 | 55304 | 106386 | -1.5499 | 0.0000 | |
| GSE53624 | SPTLC3 | 55304 | 106386 | -1.4970 | 0.0000 | |
| GSE63941 | SPTLC3 | 55304 | 227752_at | -0.7466 | 0.2449 | |
| GSE77861 | SPTLC3 | 55304 | 227752_at | -0.6806 | 0.0017 | |
| GSE97050 | SPTLC3 | 55304 | A_33_P3415395 | -0.0975 | 0.7743 | |
| SRP007169 | SPTLC3 | 55304 | RNAseq | -1.8625 | 0.0000 | |
| SRP008496 | SPTLC3 | 55304 | RNAseq | -1.5902 | 0.0002 | |
| SRP064894 | SPTLC3 | 55304 | RNAseq | -1.0591 | 0.0210 | |
| SRP133303 | SPTLC3 | 55304 | RNAseq | -0.3115 | 0.1053 | |
| SRP159526 | SPTLC3 | 55304 | RNAseq | -0.4907 | 0.7348 | |
| SRP193095 | SPTLC3 | 55304 | RNAseq | 0.0239 | 0.9298 | |
| SRP219564 | SPTLC3 | 55304 | RNAseq | 0.1299 | 0.8158 | |
| TCGA | SPTLC3 | 55304 | RNAseq | -0.4076 | 0.0947 |
Upregulated datasets: 0; Downregulated datasets: 6.
Survival by SPTLC3 expression:
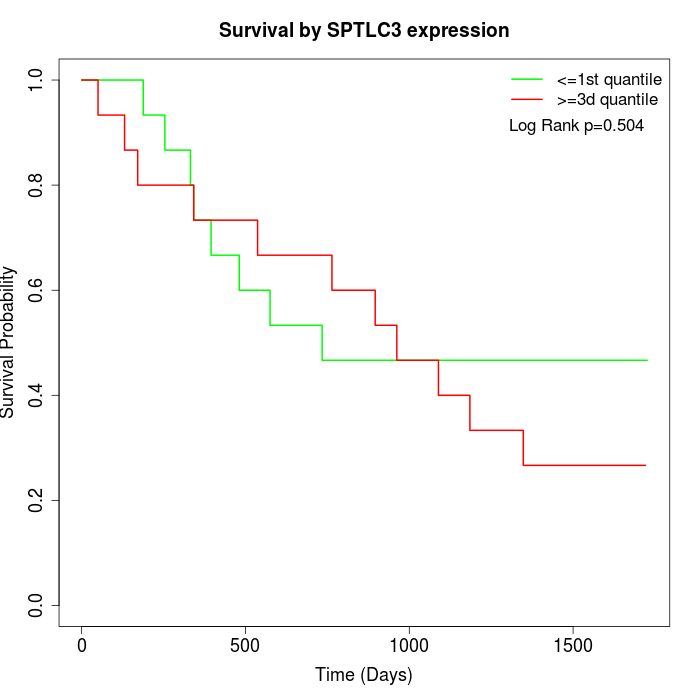 | 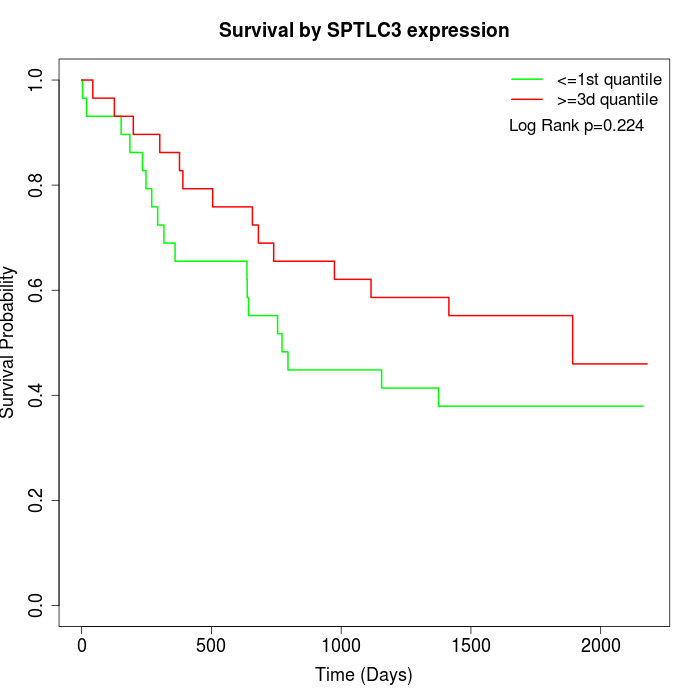 | 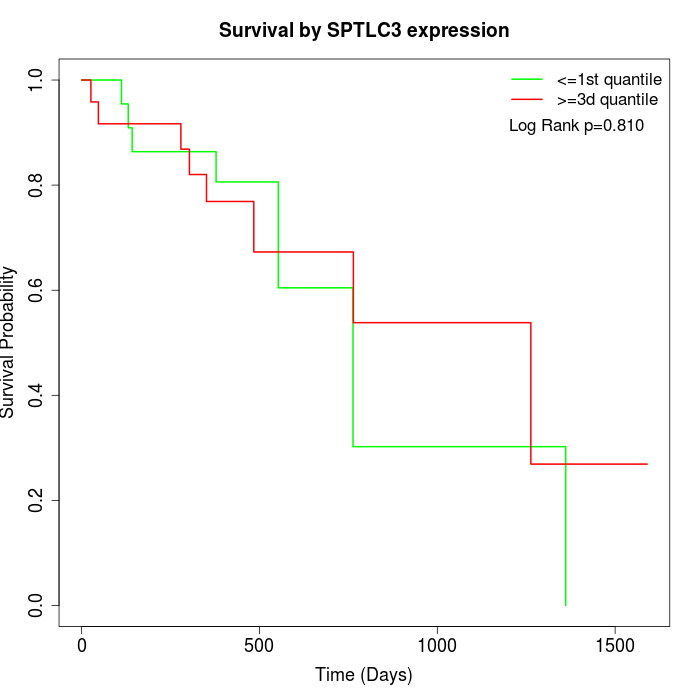 |
| GSE53622 | GSE53624 | TCGA |
Note: Click image to view full size file.
Copy number change of SPTLC3:
| Dataset | Gene | EntrezID | Gain | Loss | Normal | Detail |
|---|---|---|---|---|---|---|
| GSE15526 | SPTLC3 | 55304 | 10 | 1 | 19 | |
| GSE20123 | SPTLC3 | 55304 | 10 | 1 | 19 | |
| GSE43470 | SPTLC3 | 55304 | 11 | 1 | 31 | |
| GSE46452 | SPTLC3 | 55304 | 26 | 1 | 32 | |
| GSE47630 | SPTLC3 | 55304 | 18 | 4 | 18 | |
| GSE54993 | SPTLC3 | 55304 | 1 | 15 | 54 | |
| GSE54994 | SPTLC3 | 55304 | 25 | 1 | 27 | |
| GSE60625 | SPTLC3 | 55304 | 0 | 0 | 11 | |
| GSE74703 | SPTLC3 | 55304 | 8 | 1 | 27 | |
| GSE74704 | SPTLC3 | 55304 | 5 | 1 | 14 | |
| TCGA | SPTLC3 | 55304 | 42 | 10 | 44 |
Total number of gains: 156; Total number of losses: 36; Total Number of normals: 296.
Somatic mutations of SPTLC3:
Generating mutation plots.
Highly correlated genes for SPTLC3:
Showing top 20/963 corelated genes with mean PCC>0.5.
| Gene1 | Gene2 | Mean PCC | Num. Datasets | Num. PCC<0 | Num. PCC>0.5 |
|---|---|---|---|---|---|
| SPTLC3 | EAF1 | 0.818238 | 3 | 0 | 3 |
| SPTLC3 | SNX14 | 0.806911 | 3 | 0 | 3 |
| SPTLC3 | RECK | 0.800312 | 3 | 0 | 3 |
| SPTLC3 | ZNF416 | 0.771202 | 4 | 0 | 4 |
| SPTLC3 | MRPS27 | 0.76449 | 3 | 0 | 3 |
| SPTLC3 | HEMK1 | 0.761569 | 3 | 0 | 3 |
| SPTLC3 | CETN3 | 0.760659 | 4 | 0 | 3 |
| SPTLC3 | FAM83D | 0.753454 | 3 | 0 | 3 |
| SPTLC3 | C11orf54 | 0.749531 | 3 | 0 | 3 |
| SPTLC3 | SOCS6 | 0.749162 | 4 | 0 | 3 |
| SPTLC3 | CYP1A2 | 0.737778 | 4 | 0 | 4 |
| SPTLC3 | PDLIM2 | 0.733682 | 5 | 0 | 5 |
| SPTLC3 | OPHN1 | 0.732241 | 6 | 0 | 5 |
| SPTLC3 | PRKCH | 0.728836 | 4 | 0 | 4 |
| SPTLC3 | DUSP22 | 0.719466 | 6 | 0 | 6 |
| SPTLC3 | SLC35F5 | 0.718332 | 4 | 0 | 4 |
| SPTLC3 | ZFAND2B | 0.714874 | 6 | 0 | 6 |
| SPTLC3 | CNP | 0.713595 | 3 | 0 | 3 |
| SPTLC3 | CWH43 | 0.710615 | 6 | 0 | 5 |
| SPTLC3 | FCGBP | 0.710434 | 3 | 0 | 3 |
For details and further investigation, click here