| Full name: signal transducer and activator of transcription 3 | Alias Symbol: APRF | ||
| Type: protein-coding gene | Cytoband: 17q21.2 | ||
| Entrez ID: 6774 | HGNC ID: HGNC:11364 | Ensembl Gene: ENSG00000168610 | OMIM ID: 102582 |
| Related drugs: ACITRETIN, ATIPRIMOD, BARDOXOLONE METHYL... [more] | |||
Screen Evidence:
| |||
STAT3 involved pathways:
Expression of STAT3:
| Dataset | Gene | EntrezID | Probe | Log2FC | Adj.pValue | Expression |
|---|---|---|---|---|---|---|
| GSE17351 | STAT3 | 6774 | 208991_at | -0.0362 | 0.9513 | |
| GSE20347 | STAT3 | 6774 | 208991_at | -0.2203 | 0.3488 | |
| GSE23400 | STAT3 | 6774 | 208991_at | 0.1075 | 0.1549 | |
| GSE26886 | STAT3 | 6774 | 208991_at | -0.7374 | 0.0278 | |
| GSE29001 | STAT3 | 6774 | 208991_at | -0.0957 | 0.7666 | |
| GSE38129 | STAT3 | 6774 | 208991_at | -0.1990 | 0.2169 | |
| GSE45670 | STAT3 | 6774 | 208991_at | 0.4102 | 0.0021 | |
| GSE53622 | STAT3 | 6774 | 78123 | 0.1612 | 0.0053 | |
| GSE53624 | STAT3 | 6774 | 78123 | -0.0882 | 0.1052 | |
| GSE63941 | STAT3 | 6774 | 208991_at | -0.7312 | 0.2250 | |
| GSE77861 | STAT3 | 6774 | 208991_at | 0.3205 | 0.2129 | |
| GSE97050 | STAT3 | 6774 | A_24_P116805 | 0.8806 | 0.1095 | |
| SRP007169 | STAT3 | 6774 | RNAseq | -0.5679 | 0.0766 | |
| SRP008496 | STAT3 | 6774 | RNAseq | -0.8810 | 0.0001 | |
| SRP064894 | STAT3 | 6774 | RNAseq | 0.1104 | 0.5478 | |
| SRP133303 | STAT3 | 6774 | RNAseq | 0.2118 | 0.1535 | |
| SRP159526 | STAT3 | 6774 | RNAseq | 0.1620 | 0.6249 | |
| SRP193095 | STAT3 | 6774 | RNAseq | -0.0404 | 0.7717 | |
| SRP219564 | STAT3 | 6774 | RNAseq | -0.0372 | 0.9068 | |
| TCGA | STAT3 | 6774 | RNAseq | 0.0249 | 0.5594 |
Upregulated datasets: 0; Downregulated datasets: 0.
Survival by STAT3 expression:
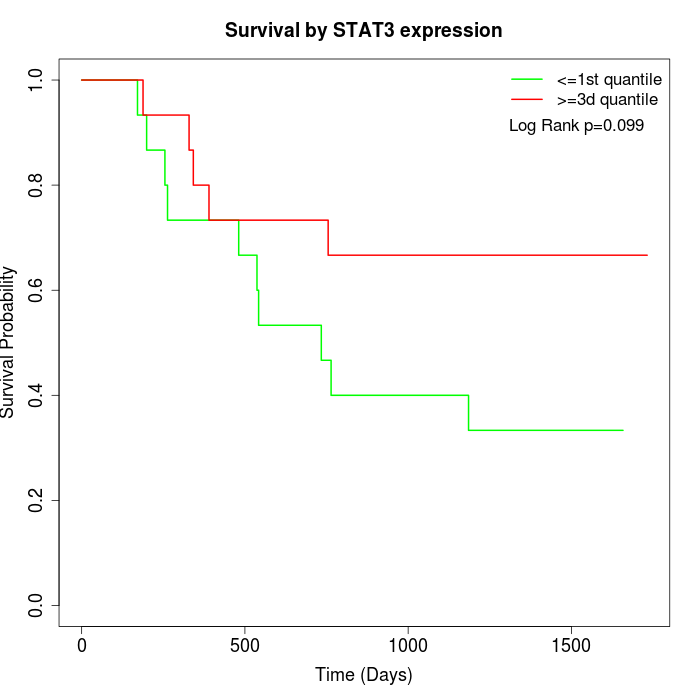 | 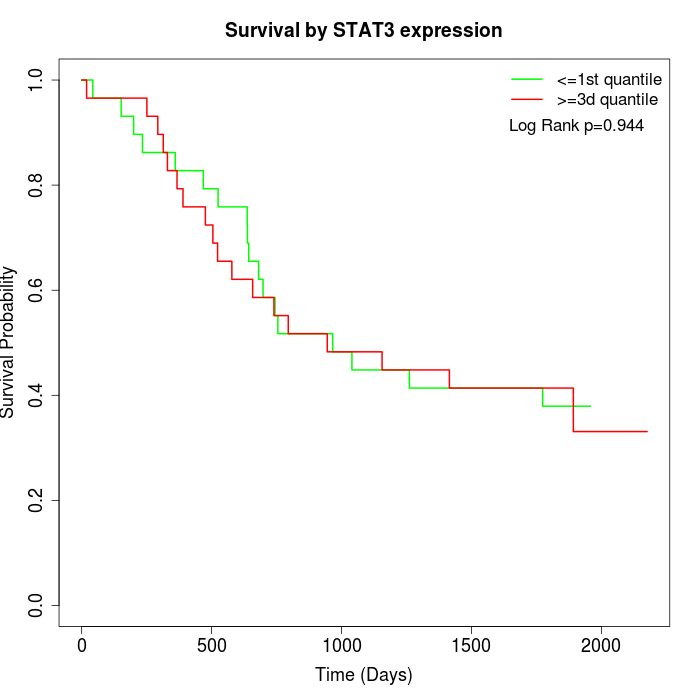 | 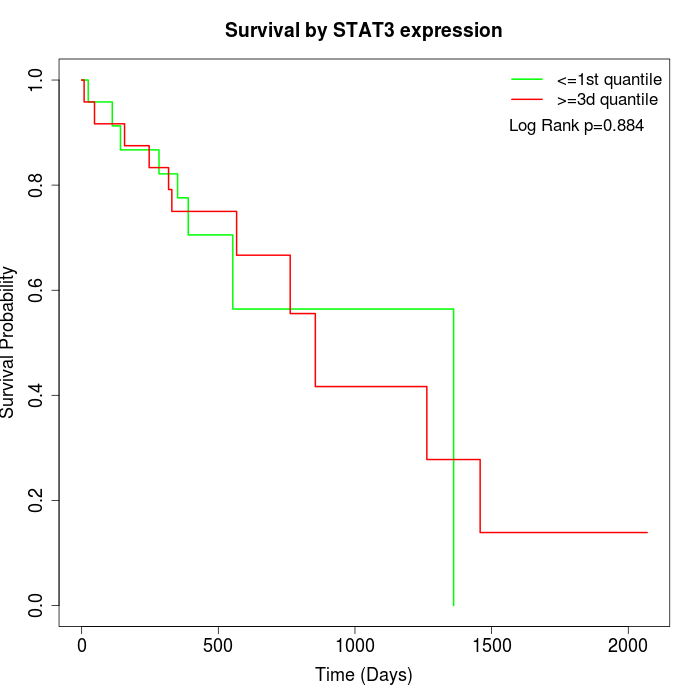 |
| GSE53622 | GSE53624 | TCGA |
Note: Click image to view full size file.
Copy number change of STAT3:
| Dataset | Gene | EntrezID | Gain | Loss | Normal | Detail |
|---|---|---|---|---|---|---|
| GSE15526 | STAT3 | 6774 | 6 | 2 | 22 | |
| GSE20123 | STAT3 | 6774 | 6 | 2 | 22 | |
| GSE43470 | STAT3 | 6774 | 1 | 2 | 40 | |
| GSE46452 | STAT3 | 6774 | 34 | 0 | 25 | |
| GSE47630 | STAT3 | 6774 | 8 | 1 | 31 | |
| GSE54993 | STAT3 | 6774 | 3 | 4 | 63 | |
| GSE54994 | STAT3 | 6774 | 8 | 5 | 40 | |
| GSE60625 | STAT3 | 6774 | 4 | 0 | 7 | |
| GSE74703 | STAT3 | 6774 | 1 | 1 | 34 | |
| GSE74704 | STAT3 | 6774 | 4 | 1 | 15 | |
| TCGA | STAT3 | 6774 | 23 | 6 | 67 |
Total number of gains: 98; Total number of losses: 24; Total Number of normals: 366.
Somatic mutations of STAT3:
Generating mutation plots.
Highly correlated genes for STAT3:
Showing top 20/45 corelated genes with mean PCC>0.5.
| Gene1 | Gene2 | Mean PCC | Num. Datasets | Num. PCC<0 | Num. PCC>0.5 |
|---|---|---|---|---|---|
| STAT3 | MCOLN2 | 0.625126 | 3 | 0 | 3 |
| STAT3 | CD14 | 0.621044 | 4 | 0 | 4 |
| STAT3 | KLK6 | 0.611303 | 4 | 0 | 3 |
| STAT3 | TRAPPC11 | 0.596275 | 3 | 0 | 3 |
| STAT3 | LPAR6 | 0.596101 | 4 | 0 | 4 |
| STAT3 | TMC8 | 0.58902 | 3 | 0 | 3 |
| STAT3 | FAM43A | 0.587386 | 4 | 0 | 3 |
| STAT3 | HSD17B2 | 0.587279 | 3 | 0 | 3 |
| STAT3 | SLC28A3 | 0.585991 | 4 | 0 | 3 |
| STAT3 | FRMD8 | 0.583749 | 4 | 0 | 3 |
| STAT3 | IRAK2 | 0.580655 | 3 | 0 | 3 |
| STAT3 | TOP1 | 0.576559 | 4 | 0 | 3 |
| STAT3 | LPXN | 0.574819 | 4 | 0 | 3 |
| STAT3 | SLCO2A1 | 0.570002 | 3 | 0 | 3 |
| STAT3 | S100A7 | 0.562701 | 5 | 0 | 4 |
| STAT3 | CSF2RB | 0.561889 | 6 | 0 | 3 |
| STAT3 | CDK5RAP3 | 0.560981 | 4 | 0 | 3 |
| STAT3 | COASY | 0.558416 | 4 | 0 | 3 |
| STAT3 | SOD2 | 0.556515 | 5 | 0 | 4 |
| STAT3 | PDZK1IP1 | 0.553402 | 6 | 0 | 4 |
For details and further investigation, click here