| Full name: STK4 antisense RNA 1 (head to head) | Alias Symbol: | ||
| Type: non-coding RNA | Cytoband: 20q13.12 | ||
| Entrez ID: 100505826 | HGNC ID: HGNC:43811 | Ensembl Gene: ENSG00000227477 | OMIM ID: |
Expression of STK4-AS1:
| Dataset | Gene | EntrezID | Probe | Log2FC | Adj.pValue | Expression |
|---|---|---|---|---|---|---|
| GSE17351 | STK4-AS1 | 100505826 | 236695_at | 0.2283 | 0.4826 | |
| GSE26886 | STK4-AS1 | 100505826 | 236695_at | 0.0332 | 0.8642 | |
| GSE45670 | STK4-AS1 | 100505826 | 236695_at | 0.2088 | 0.0203 | |
| GSE53622 | STK4-AS1 | 100505826 | 98731 | 0.7055 | 0.0000 | |
| GSE53624 | STK4-AS1 | 100505826 | 98731 | 0.9551 | 0.0000 | |
| GSE63941 | STK4-AS1 | 100505826 | 236695_at | 0.0969 | 0.6196 | |
| GSE77861 | STK4-AS1 | 100505826 | 236695_at | -0.1000 | 0.2253 | |
| SRP133303 | STK4-AS1 | 100505826 | RNAseq | 0.1814 | 0.3990 | |
| SRP159526 | STK4-AS1 | 100505826 | RNAseq | 0.2651 | 0.6268 | |
| SRP193095 | STK4-AS1 | 100505826 | RNAseq | -0.0744 | 0.5623 | |
| SRP219564 | STK4-AS1 | 100505826 | RNAseq | 0.9312 | 0.0757 |
Upregulated datasets: 0; Downregulated datasets: 0.
Survival by STK4-AS1 expression:
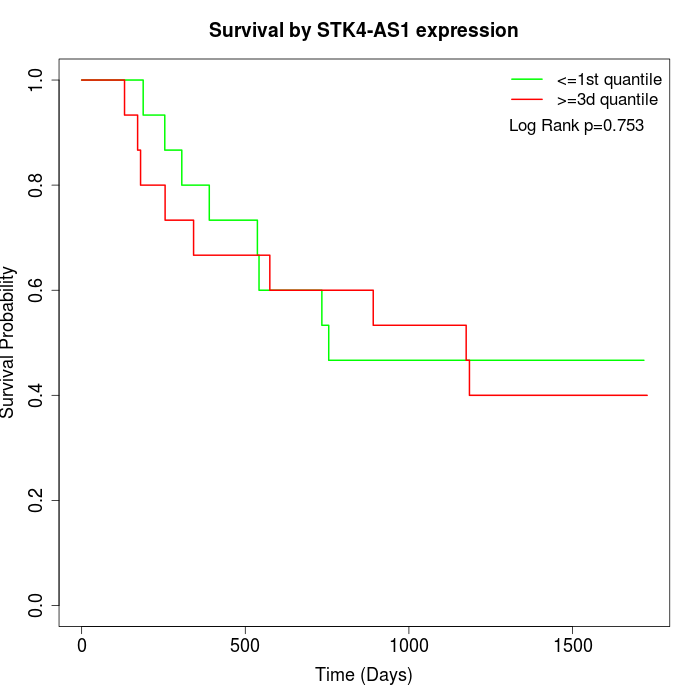 | 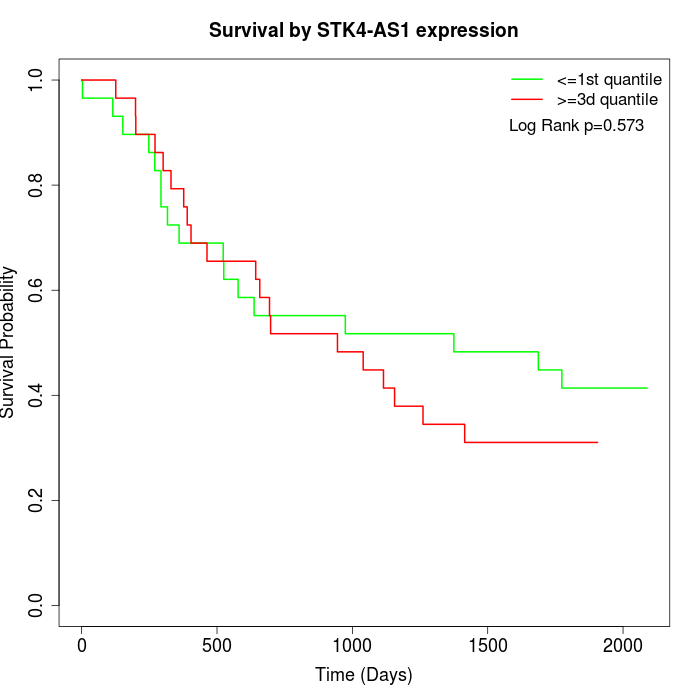 |
| GSE53622 | GSE53624 |
Note: Click image to view full size file.
Copy number change of STK4-AS1:
| Dataset | Gene | EntrezID | Gain | Loss | Normal | Detail |
|---|---|---|---|---|---|---|
| GSE15526 | STK4-AS1 | 100505826 | 13 | 1 | 16 | |
| GSE20123 | STK4-AS1 | 100505826 | 13 | 1 | 16 | |
| GSE43470 | STK4-AS1 | 100505826 | 12 | 1 | 30 | |
| GSE46452 | STK4-AS1 | 100505826 | 29 | 0 | 30 | |
| GSE47630 | STK4-AS1 | 100505826 | 24 | 1 | 15 | |
| GSE54993 | STK4-AS1 | 100505826 | 0 | 17 | 53 | |
| GSE54994 | STK4-AS1 | 100505826 | 25 | 0 | 28 | |
| GSE60625 | STK4-AS1 | 100505826 | 0 | 0 | 11 | |
| GSE74703 | STK4-AS1 | 100505826 | 10 | 1 | 25 | |
| GSE74704 | STK4-AS1 | 100505826 | 9 | 0 | 11 |
Total number of gains: 135; Total number of losses: 22; Total Number of normals: 235.
Somatic mutations of STK4-AS1:
Generating mutation plots.
Highly correlated genes for STK4-AS1:
Showing top 20/49 corelated genes with mean PCC>0.5.
| Gene1 | Gene2 | Mean PCC | Num. Datasets | Num. PCC<0 | Num. PCC>0.5 |
|---|---|---|---|---|---|
| STK4-AS1 | ACTR5 | 0.693928 | 4 | 0 | 4 |
| STK4-AS1 | CSTF1 | 0.678817 | 4 | 0 | 3 |
| STK4-AS1 | IGSF6 | 0.66525 | 3 | 0 | 3 |
| STK4-AS1 | DPM1 | 0.633898 | 4 | 0 | 4 |
| STK4-AS1 | CSE1L | 0.626431 | 4 | 0 | 4 |
| STK4-AS1 | MRPL28 | 0.623069 | 4 | 0 | 3 |
| STK4-AS1 | DHODH | 0.621629 | 4 | 0 | 4 |
| STK4-AS1 | TP53RK | 0.619957 | 3 | 0 | 3 |
| STK4-AS1 | DNTTIP1 | 0.615995 | 4 | 0 | 3 |
| STK4-AS1 | IRAK2 | 0.607611 | 3 | 0 | 3 |
| STK4-AS1 | ZSWIM1 | 0.606884 | 4 | 0 | 4 |
| STK4-AS1 | FITM2 | 0.603875 | 4 | 0 | 3 |
| STK4-AS1 | SUB1 | 0.603249 | 3 | 0 | 3 |
| STK4-AS1 | MRGBP | 0.597344 | 4 | 0 | 4 |
| STK4-AS1 | MTFR1 | 0.592003 | 4 | 0 | 3 |
| STK4-AS1 | PFDN4 | 0.58387 | 4 | 0 | 3 |
| STK4-AS1 | HEYL | 0.582184 | 3 | 0 | 3 |
| STK4-AS1 | TMEM67 | 0.57854 | 4 | 0 | 3 |
| STK4-AS1 | CTSA | 0.57729 | 5 | 0 | 4 |
| STK4-AS1 | ERGIC3 | 0.569872 | 5 | 0 | 3 |
For details and further investigation, click here