| Full name: sperm tail PG-rich repeat containing 1 | Alias Symbol: FLJ33340|MAPO2 | ||
| Type: protein-coding gene | Cytoband: 1p36.11 | ||
| Entrez ID: 90529 | HGNC ID: HGNC:28070 | Ensembl Gene: ENSG00000001460 | OMIM ID: 615826 |
Expression of STPG1:
| Dataset | Gene | EntrezID | Probe | Log2FC | Adj.pValue | Expression |
|---|---|---|---|---|---|---|
| GSE17351 | STPG1 | 90529 | 227694_at | 0.4567 | 0.1659 | |
| GSE26886 | STPG1 | 90529 | 227694_at | 0.3864 | 0.0850 | |
| GSE45670 | STPG1 | 90529 | 227694_at | 0.6565 | 0.0001 | |
| GSE53622 | STPG1 | 90529 | 127214 | 0.2491 | 0.0535 | |
| GSE53624 | STPG1 | 90529 | 41438 | 0.7039 | 0.0000 | |
| GSE63941 | STPG1 | 90529 | 227694_at | 0.4788 | 0.3543 | |
| GSE77861 | STPG1 | 90529 | 227694_at | 0.7178 | 0.0042 | |
| SRP007169 | STPG1 | 90529 | RNAseq | -0.0342 | 0.9348 | |
| SRP008496 | STPG1 | 90529 | RNAseq | 0.4113 | 0.2359 | |
| SRP064894 | STPG1 | 90529 | RNAseq | 0.4582 | 0.0431 | |
| SRP133303 | STPG1 | 90529 | RNAseq | 0.3247 | 0.2601 | |
| SRP159526 | STPG1 | 90529 | RNAseq | 0.5156 | 0.0747 | |
| SRP193095 | STPG1 | 90529 | RNAseq | 0.2505 | 0.1827 | |
| SRP219564 | STPG1 | 90529 | RNAseq | 0.0036 | 0.9943 |
Upregulated datasets: 0; Downregulated datasets: 0.
Survival by STPG1 expression:
 | 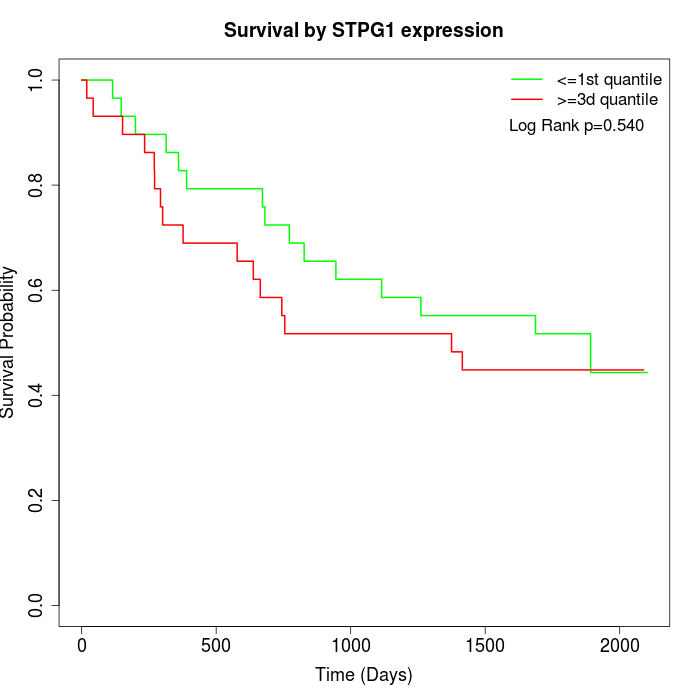 |
| GSE53622 | GSE53624 |
Note: Click image to view full size file.
Copy number change of STPG1:
| Dataset | Gene | EntrezID | Gain | Loss | Normal | Detail |
|---|---|---|---|---|---|---|
| GSE15526 | STPG1 | 90529 | 0 | 5 | 25 | |
| GSE20123 | STPG1 | 90529 | 0 | 4 | 26 | |
| GSE43470 | STPG1 | 90529 | 2 | 6 | 35 | |
| GSE46452 | STPG1 | 90529 | 5 | 1 | 53 | |
| GSE47630 | STPG1 | 90529 | 8 | 3 | 29 | |
| GSE54993 | STPG1 | 90529 | 2 | 1 | 67 | |
| GSE54994 | STPG1 | 90529 | 11 | 4 | 38 | |
| GSE60625 | STPG1 | 90529 | 0 | 0 | 11 | |
| GSE74703 | STPG1 | 90529 | 1 | 4 | 31 | |
| GSE74704 | STPG1 | 90529 | 0 | 0 | 20 | |
| TCGA | STPG1 | 90529 | 10 | 23 | 63 |
Total number of gains: 39; Total number of losses: 51; Total Number of normals: 398.
Somatic mutations of STPG1:
Generating mutation plots.
Highly correlated genes for STPG1:
Showing top 20/605 corelated genes with mean PCC>0.5.
| Gene1 | Gene2 | Mean PCC | Num. Datasets | Num. PCC<0 | Num. PCC>0.5 |
|---|---|---|---|---|---|
| STPG1 | IRF6 | 0.776495 | 3 | 0 | 3 |
| STPG1 | LSM4 | 0.769327 | 3 | 0 | 3 |
| STPG1 | EMG1 | 0.7542 | 3 | 0 | 3 |
| STPG1 | CD276 | 0.744753 | 3 | 0 | 3 |
| STPG1 | HAS3 | 0.737196 | 3 | 0 | 3 |
| STPG1 | FZD6 | 0.737165 | 3 | 0 | 3 |
| STPG1 | GANAB | 0.730228 | 3 | 0 | 3 |
| STPG1 | LMNB2 | 0.726016 | 4 | 0 | 4 |
| STPG1 | MCM5 | 0.717172 | 3 | 0 | 3 |
| STPG1 | FEN1 | 0.712361 | 3 | 0 | 3 |
| STPG1 | BSG | 0.709555 | 4 | 0 | 4 |
| STPG1 | MRPL4 | 0.706168 | 3 | 0 | 3 |
| STPG1 | RCC2 | 0.705431 | 3 | 0 | 3 |
| STPG1 | CDC45 | 0.704324 | 4 | 0 | 4 |
| STPG1 | SNRPG | 0.704177 | 3 | 0 | 3 |
| STPG1 | HAUS8 | 0.70185 | 4 | 0 | 3 |
| STPG1 | RFC4 | 0.70108 | 4 | 0 | 3 |
| STPG1 | PLXNA1 | 0.699916 | 4 | 0 | 4 |
| STPG1 | SLC1A5 | 0.69883 | 3 | 0 | 3 |
| STPG1 | SIX4 | 0.694196 | 4 | 0 | 4 |
For details and further investigation, click here