| Full name: tubulin beta 3 class III | Alias Symbol: beta-4|CFEOM3|CFEOM3A | ||
| Type: protein-coding gene | Cytoband: 16q24.3 | ||
| Entrez ID: 10381 | HGNC ID: HGNC:20772 | Ensembl Gene: ENSG00000258947 | OMIM ID: 602661 |
| Related drugs: BRENTUXIMAB VEDOTIN, CABAZITAXEL, COLCHICINE, COMBRETASTATIN A4, CROLIBULIN, DAVUNETIDE, DOCETAXEL, DOCETAXEL HYDRATE, ERIBULIN MESYLATE, FOSBRETABULIN DISODIUM... [more] | |||
TUBB3 involved pathways:
| KEGG pathway | Description | View |
|---|---|---|
| hsa05130 | Pathogenic Escherichia coli infection |
Expression of TUBB3:
| Dataset | Gene | EntrezID | Probe | Log2FC | Adj.pValue | Expression |
|---|---|---|---|---|---|---|
| GSE17351 | TUBB3 | 10381 | 213476_x_at | -0.1002 | 0.8766 | |
| GSE20347 | TUBB3 | 10381 | 202154_x_at | -0.1107 | 0.5186 | |
| GSE23400 | TUBB3 | 10381 | 213476_x_at | -0.1283 | 0.0818 | |
| GSE26886 | TUBB3 | 10381 | 213476_x_at | -0.8745 | 0.0007 | |
| GSE29001 | TUBB3 | 10381 | 202154_x_at | -0.2775 | 0.1916 | |
| GSE38129 | TUBB3 | 10381 | 213476_x_at | -0.0767 | 0.6910 | |
| GSE45670 | TUBB3 | 10381 | 202154_x_at | 0.2124 | 0.1667 | |
| GSE53622 | TUBB3 | 10381 | 30154 | 0.5611 | 0.0000 | |
| GSE53624 | TUBB3 | 10381 | 30154 | 0.6802 | 0.0000 | |
| GSE63941 | TUBB3 | 10381 | 213476_x_at | 0.5561 | 0.2757 | |
| GSE77861 | TUBB3 | 10381 | 213476_x_at | 0.3329 | 0.1743 | |
| GSE97050 | TUBB3 | 10381 | A_23_P77493 | 1.6504 | 0.1398 | |
| SRP007169 | TUBB3 | 10381 | RNAseq | 1.7612 | 0.0059 | |
| SRP008496 | TUBB3 | 10381 | RNAseq | 1.5623 | 0.0002 | |
| SRP064894 | TUBB3 | 10381 | RNAseq | 3.5760 | 0.0000 | |
| SRP133303 | TUBB3 | 10381 | RNAseq | 4.1889 | 0.0000 | |
| SRP159526 | TUBB3 | 10381 | RNAseq | 2.7128 | 0.0006 | |
| SRP219564 | TUBB3 | 10381 | RNAseq | 1.5933 | 0.0669 | |
| TCGA | TUBB3 | 10381 | RNAseq | 0.6028 | 0.0000 |
Upregulated datasets: 5; Downregulated datasets: 0.
Survival by TUBB3 expression:
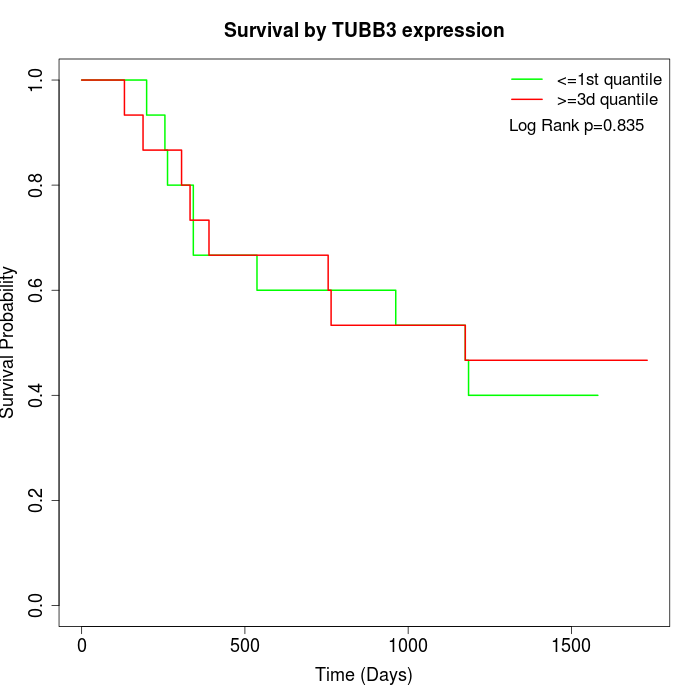 | 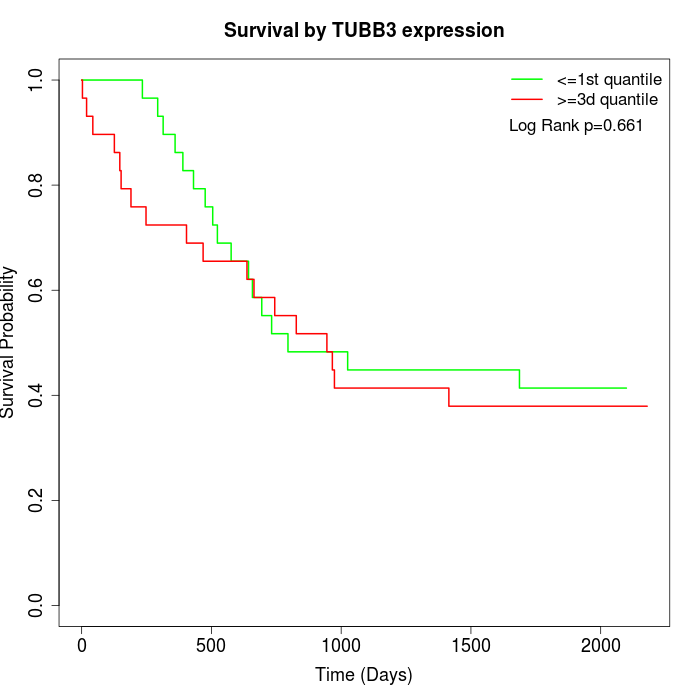 | 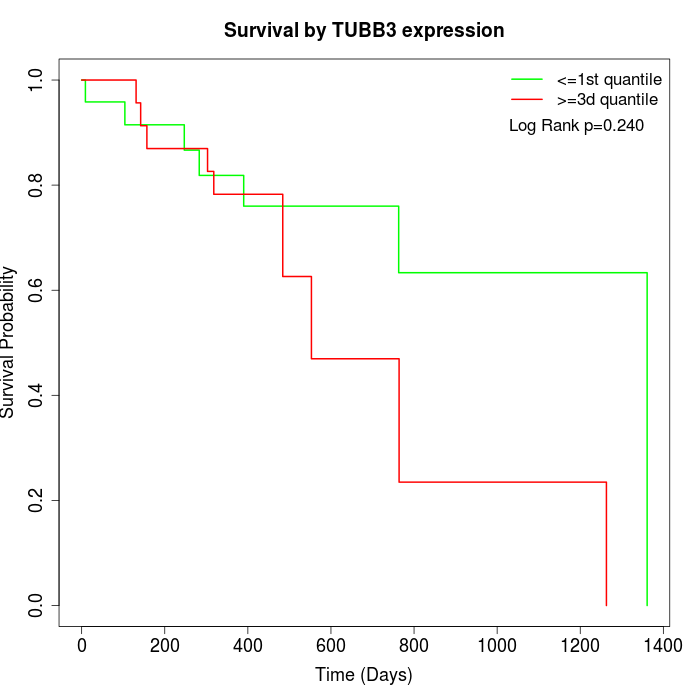 |
| GSE53622 | GSE53624 | TCGA |
Note: Click image to view full size file.
Copy number change of TUBB3:
| Dataset | Gene | EntrezID | Gain | Loss | Normal | Detail |
|---|---|---|---|---|---|---|
| GSE15526 | TUBB3 | 10381 | 4 | 3 | 23 | |
| GSE20123 | TUBB3 | 10381 | 4 | 3 | 23 | |
| GSE43470 | TUBB3 | 10381 | 1 | 13 | 29 | |
| GSE46452 | TUBB3 | 10381 | 38 | 1 | 20 | |
| GSE47630 | TUBB3 | 10381 | 11 | 9 | 20 | |
| GSE54993 | TUBB3 | 10381 | 3 | 4 | 63 | |
| GSE54994 | TUBB3 | 10381 | 9 | 11 | 33 | |
| GSE60625 | TUBB3 | 10381 | 4 | 0 | 7 | |
| GSE74703 | TUBB3 | 10381 | 1 | 9 | 26 | |
| GSE74704 | TUBB3 | 10381 | 3 | 1 | 16 | |
| TCGA | TUBB3 | 10381 | 26 | 15 | 55 |
Total number of gains: 104; Total number of losses: 69; Total Number of normals: 315.
Somatic mutations of TUBB3:
Generating mutation plots.
Highly correlated genes for TUBB3:
Showing top 20/79 corelated genes with mean PCC>0.5.
| Gene1 | Gene2 | Mean PCC | Num. Datasets | Num. PCC<0 | Num. PCC>0.5 |
|---|---|---|---|---|---|
| TUBB3 | TUBB4B | 0.753756 | 10 | 0 | 9 |
| TUBB3 | RAB12 | 0.689878 | 3 | 0 | 3 |
| TUBB3 | DUSP11 | 0.661203 | 3 | 0 | 3 |
| TUBB3 | SLC27A4 | 0.660882 | 4 | 0 | 4 |
| TUBB3 | SERPINB7 | 0.658071 | 3 | 0 | 3 |
| TUBB3 | LRRC43 | 0.650447 | 3 | 0 | 3 |
| TUBB3 | COPA | 0.647592 | 3 | 0 | 3 |
| TUBB3 | PPP3R1 | 0.630616 | 3 | 0 | 3 |
| TUBB3 | HM13 | 0.612071 | 3 | 0 | 3 |
| TUBB3 | ASL | 0.607 | 3 | 0 | 3 |
| TUBB3 | CDK9 | 0.604959 | 7 | 0 | 5 |
| TUBB3 | CLASP1 | 0.597744 | 4 | 0 | 3 |
| TUBB3 | MAP4K4 | 0.59547 | 6 | 0 | 6 |
| TUBB3 | BZW1 | 0.586947 | 3 | 0 | 3 |
| TUBB3 | CHMP1B | 0.584648 | 6 | 0 | 3 |
| TUBB3 | DMKN | 0.582121 | 4 | 0 | 3 |
| TUBB3 | NOD2 | 0.581373 | 3 | 0 | 3 |
| TUBB3 | PPP2R2C | 0.580585 | 3 | 0 | 3 |
| TUBB3 | CEACAM19 | 0.578411 | 5 | 0 | 4 |
| TUBB3 | KRT6A | 0.576439 | 4 | 0 | 3 |
For details and further investigation, click here