| Full name: urotensin 2 | Alias Symbol: UII|U-II|UCN2|PRO1068 | ||
| Type: protein-coding gene | Cytoband: 1p36.23 | ||
| Entrez ID: 10911 | HGNC ID: HGNC:12636 | Ensembl Gene: ENSG00000049247 | OMIM ID: 604097 |
Expression of UTS2:
| Dataset | Gene | EntrezID | Probe | Log2FC | Adj.pValue | Expression |
|---|---|---|---|---|---|---|
| GSE17351 | UTS2 | 10911 | 220784_s_at | 0.5672 | 0.6015 | |
| GSE20347 | UTS2 | 10911 | 220784_s_at | 0.3446 | 0.2786 | |
| GSE23400 | UTS2 | 10911 | 220785_at | 0.1377 | 0.0458 | |
| GSE26886 | UTS2 | 10911 | 220785_at | 0.0748 | 0.3331 | |
| GSE29001 | UTS2 | 10911 | 220784_s_at | 0.5199 | 0.2755 | |
| GSE38129 | UTS2 | 10911 | 220784_s_at | 0.5642 | 0.0292 | |
| GSE45670 | UTS2 | 10911 | 220784_s_at | 0.1194 | 0.8614 | |
| GSE53622 | UTS2 | 10911 | 85710 | 0.3630 | 0.0957 | |
| GSE53624 | UTS2 | 10911 | 85710 | 0.6318 | 0.0124 | |
| GSE63941 | UTS2 | 10911 | 220785_at | 0.5331 | 0.5303 | |
| GSE77861 | UTS2 | 10911 | 220785_at | 0.0429 | 0.5916 | |
| GSE97050 | UTS2 | 10911 | A_23_P63343 | 0.3710 | 0.2737 | |
| SRP159526 | UTS2 | 10911 | RNAseq | -1.2499 | 0.0192 | |
| SRP219564 | UTS2 | 10911 | RNAseq | 0.6521 | 0.2755 | |
| TCGA | UTS2 | 10911 | RNAseq | 5.1851 | 0.0000 |
Upregulated datasets: 1; Downregulated datasets: 1.
Survival by UTS2 expression:
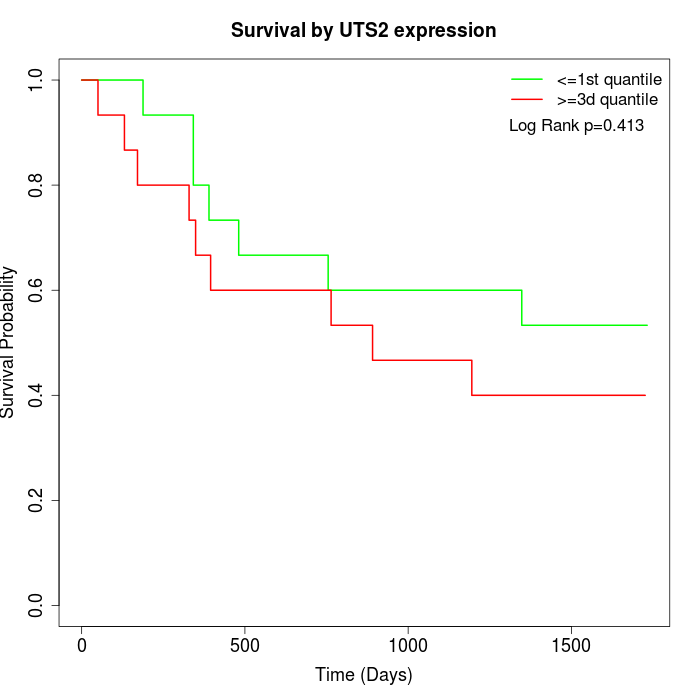 | 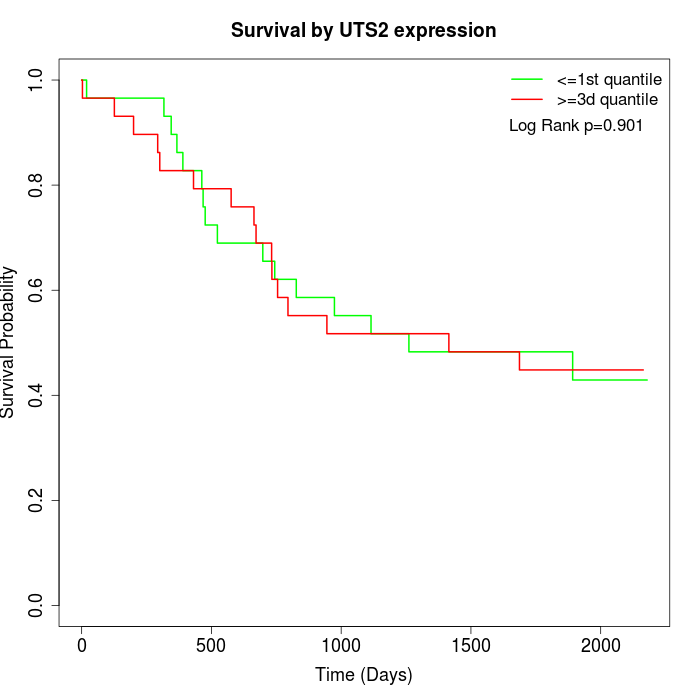 | 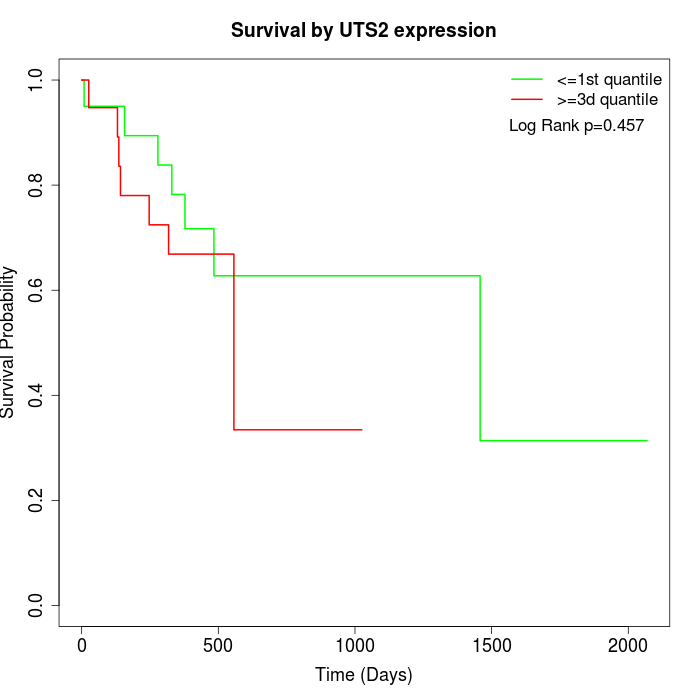 |
| GSE53622 | GSE53624 | TCGA |
Note: Click image to view full size file.
Copy number change of UTS2:
| Dataset | Gene | EntrezID | Gain | Loss | Normal | Detail |
|---|---|---|---|---|---|---|
| GSE15526 | UTS2 | 10911 | 2 | 5 | 23 | |
| GSE20123 | UTS2 | 10911 | 2 | 4 | 24 | |
| GSE43470 | UTS2 | 10911 | 6 | 5 | 32 | |
| GSE46452 | UTS2 | 10911 | 7 | 1 | 51 | |
| GSE47630 | UTS2 | 10911 | 8 | 4 | 28 | |
| GSE54993 | UTS2 | 10911 | 3 | 2 | 65 | |
| GSE54994 | UTS2 | 10911 | 14 | 3 | 36 | |
| GSE60625 | UTS2 | 10911 | 0 | 0 | 11 | |
| GSE74703 | UTS2 | 10911 | 5 | 3 | 28 | |
| GSE74704 | UTS2 | 10911 | 2 | 0 | 18 | |
| TCGA | UTS2 | 10911 | 11 | 22 | 63 |
Total number of gains: 60; Total number of losses: 49; Total Number of normals: 379.
Somatic mutations of UTS2:
Generating mutation plots.
Highly correlated genes for UTS2:
Showing top 20/55 corelated genes with mean PCC>0.5.
| Gene1 | Gene2 | Mean PCC | Num. Datasets | Num. PCC<0 | Num. PCC>0.5 |
|---|---|---|---|---|---|
| UTS2 | CCDC88B | 0.688794 | 3 | 0 | 3 |
| UTS2 | GTPBP3 | 0.675392 | 3 | 0 | 3 |
| UTS2 | GFER | 0.673448 | 3 | 0 | 3 |
| UTS2 | POPDC3 | 0.639663 | 3 | 0 | 3 |
| UTS2 | SLC7A11 | 0.627784 | 4 | 0 | 3 |
| UTS2 | C16orf74 | 0.621746 | 3 | 0 | 3 |
| UTS2 | NMB | 0.61768 | 3 | 0 | 3 |
| UTS2 | CDC6 | 0.612432 | 3 | 0 | 3 |
| UTS2 | C11orf24 | 0.605765 | 4 | 0 | 4 |
| UTS2 | FOXE1 | 0.603329 | 4 | 0 | 3 |
| UTS2 | AMIGO2 | 0.602061 | 4 | 0 | 3 |
| UTS2 | MAP6D1 | 0.601516 | 3 | 0 | 3 |
| UTS2 | POLD1 | 0.60102 | 3 | 0 | 3 |
| UTS2 | CHPF | 0.60058 | 3 | 0 | 3 |
| UTS2 | PTRH2 | 0.597263 | 4 | 0 | 4 |
| UTS2 | FSCN1 | 0.59378 | 4 | 0 | 3 |
| UTS2 | DEPDC1 | 0.5935 | 3 | 0 | 3 |
| UTS2 | ENTPD7 | 0.591331 | 4 | 0 | 3 |
| UTS2 | TNS4 | 0.591265 | 4 | 0 | 3 |
| UTS2 | HCK | 0.591139 | 3 | 0 | 3 |
For details and further investigation, click here