| Full name: cathepsin D | Alias Symbol: CLN10 | ||
| Type: protein-coding gene | Cytoband: 11p15.5 | ||
| Entrez ID: 1509 | HGNC ID: HGNC:2529 | Ensembl Gene: ENSG00000117984 | OMIM ID: 116840 |
| Related drugs: CHEMBL81927, GRASSYSTATIN A, NAFCILLIN, STREPTOZOTOCIN... [more] | |||
CTSD involved pathways:
| KEGG pathway | Description | View |
|---|---|---|
| hsa04071 | Sphingolipid signaling pathway | |
| hsa04210 | Apoptosis | |
| hsa05152 | Tuberculosis |
Expression of CTSD:
| Dataset | Gene | EntrezID | Probe | Log2FC | Adj.pValue | Expression |
|---|---|---|---|---|---|---|
| GSE17351 | CTSD | 1509 | 200766_at | 0.3301 | 0.2510 | |
| GSE20347 | CTSD | 1509 | 200766_at | -0.1342 | 0.3872 | |
| GSE23400 | CTSD | 1509 | 200766_at | 0.2732 | 0.0059 | |
| GSE26886 | CTSD | 1509 | 200766_at | -0.1123 | 0.7470 | |
| GSE29001 | CTSD | 1509 | 200766_at | 0.3071 | 0.4528 | |
| GSE38129 | CTSD | 1509 | 200766_at | 0.1619 | 0.2946 | |
| GSE45670 | CTSD | 1509 | 200766_at | 0.5981 | 0.0004 | |
| GSE53622 | CTSD | 1509 | 152544 | 0.5524 | 0.0000 | |
| GSE53624 | CTSD | 1509 | 122494 | 0.7252 | 0.0000 | |
| GSE63941 | CTSD | 1509 | 200766_at | 0.2899 | 0.6737 | |
| GSE77861 | CTSD | 1509 | 200766_at | 0.0684 | 0.8653 | |
| GSE97050 | CTSD | 1509 | A_33_P3243907 | 1.0226 | 0.0873 | |
| SRP007169 | CTSD | 1509 | RNAseq | 0.1534 | 0.7904 | |
| SRP008496 | CTSD | 1509 | RNAseq | -0.2899 | 0.3944 | |
| SRP064894 | CTSD | 1509 | RNAseq | 1.2781 | 0.0000 | |
| SRP133303 | CTSD | 1509 | RNAseq | 0.8090 | 0.0000 | |
| SRP159526 | CTSD | 1509 | RNAseq | 0.1032 | 0.7675 | |
| SRP193095 | CTSD | 1509 | RNAseq | 0.2960 | 0.0977 | |
| SRP219564 | CTSD | 1509 | RNAseq | 1.1936 | 0.0059 | |
| TCGA | CTSD | 1509 | RNAseq | -0.0135 | 0.7361 |
Upregulated datasets: 2; Downregulated datasets: 0.
Survival by CTSD expression:
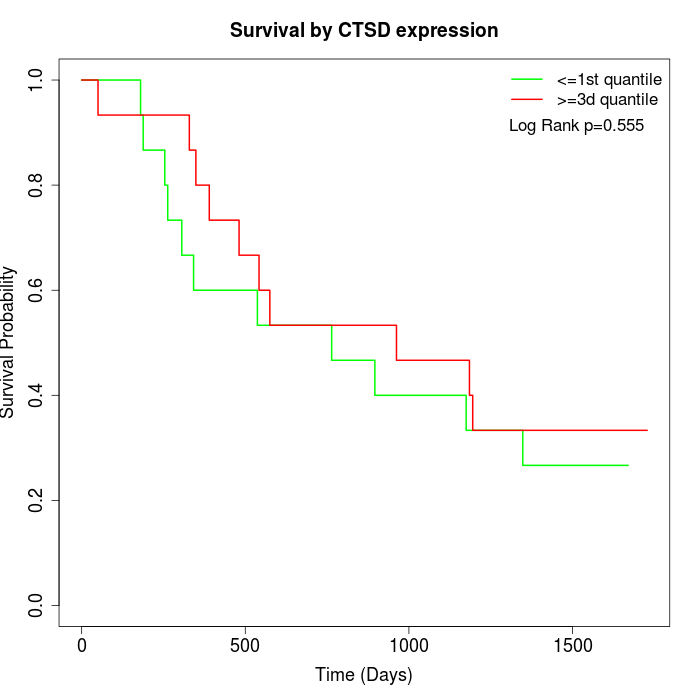 | 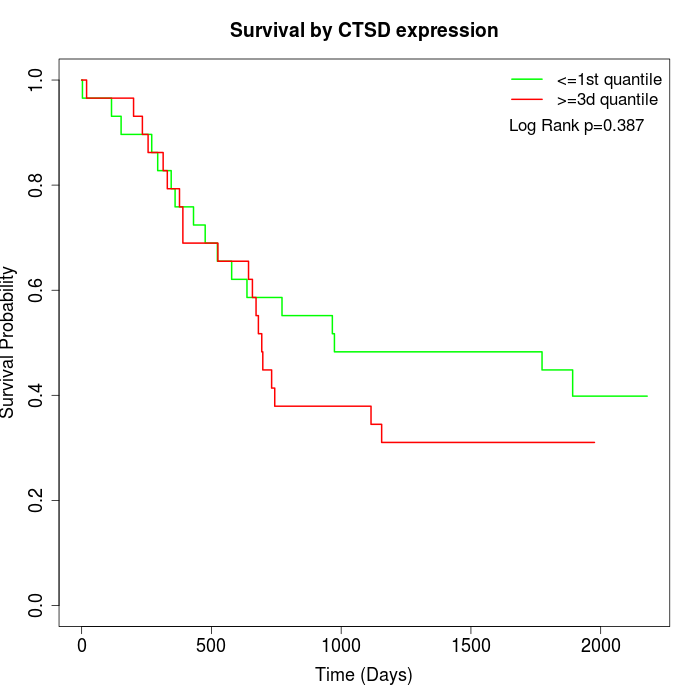 | 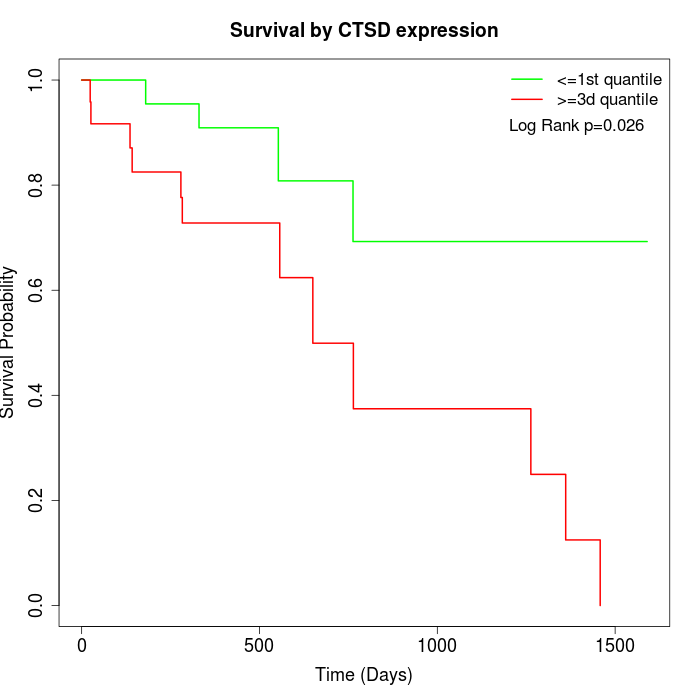 |
| GSE53622 | GSE53624 | TCGA |
Note: Click image to view full size file.
Copy number change of CTSD:
| Dataset | Gene | EntrezID | Gain | Loss | Normal | Detail |
|---|---|---|---|---|---|---|
| GSE15526 | CTSD | 1509 | 1 | 11 | 18 | |
| GSE20123 | CTSD | 1509 | 1 | 12 | 17 | |
| GSE43470 | CTSD | 1509 | 1 | 9 | 33 | |
| GSE46452 | CTSD | 1509 | 7 | 8 | 44 | |
| GSE47630 | CTSD | 1509 | 4 | 12 | 24 | |
| GSE54993 | CTSD | 1509 | 3 | 1 | 66 | |
| GSE54994 | CTSD | 1509 | 1 | 12 | 40 | |
| GSE60625 | CTSD | 1509 | 0 | 0 | 11 | |
| GSE74703 | CTSD | 1509 | 1 | 7 | 28 | |
| GSE74704 | CTSD | 1509 | 0 | 8 | 12 | |
| TCGA | CTSD | 1509 | 8 | 39 | 49 |
Total number of gains: 27; Total number of losses: 119; Total Number of normals: 342.
Somatic mutations of CTSD:
Generating mutation plots.
Highly correlated genes for CTSD:
Showing top 20/360 corelated genes with mean PCC>0.5.
| Gene1 | Gene2 | Mean PCC | Num. Datasets | Num. PCC<0 | Num. PCC>0.5 |
|---|---|---|---|---|---|
| CTSD | UBTF | 0.701762 | 3 | 0 | 3 |
| CTSD | SGSH | 0.670053 | 3 | 0 | 3 |
| CTSD | DNASE2 | 0.6668 | 3 | 0 | 3 |
| CTSD | ABCD4 | 0.662735 | 3 | 0 | 3 |
| CTSD | PLXNC1 | 0.661108 | 3 | 0 | 3 |
| CTSD | IL4I1 | 0.658524 | 5 | 0 | 5 |
| CTSD | POSTN | 0.654434 | 3 | 0 | 3 |
| CTSD | COL5A2 | 0.64768 | 3 | 0 | 3 |
| CTSD | KIAA1522 | 0.643292 | 4 | 0 | 3 |
| CTSD | RNF126 | 0.642269 | 3 | 0 | 3 |
| CTSD | COMMD5 | 0.639749 | 3 | 0 | 3 |
| CTSD | GPR84 | 0.635471 | 3 | 0 | 3 |
| CTSD | PRPF8 | 0.635437 | 4 | 0 | 3 |
| CTSD | MICB | 0.629453 | 4 | 0 | 3 |
| CTSD | SAMD1 | 0.625508 | 4 | 0 | 4 |
| CTSD | ATP6V0D2 | 0.622415 | 3 | 0 | 3 |
| CTSD | LRP1 | 0.620284 | 3 | 0 | 3 |
| CTSD | LOX | 0.619418 | 4 | 0 | 3 |
| CTSD | LIMK1 | 0.618969 | 6 | 0 | 5 |
| CTSD | RRBP1 | 0.610458 | 6 | 0 | 5 |
For details and further investigation, click here