| Full name: lysosomal associated membrane protein 1 | Alias Symbol: CD107a | ||
| Type: protein-coding gene | Cytoband: 13q34 | ||
| Entrez ID: 3916 | HGNC ID: HGNC:6499 | Ensembl Gene: ENSG00000185896 | OMIM ID: 153330 |
| Related drugs: DIMETHYL SULFOXIDE... [more] | |||
LAMP1 involved pathways:
| KEGG pathway | Description | View |
|---|---|---|
| hsa05152 | Tuberculosis |
Expression of LAMP1:
| Dataset | Gene | EntrezID | Probe | Log2FC | Adj.pValue | Expression |
|---|---|---|---|---|---|---|
| GSE17351 | LAMP1 | 3916 | 201553_s_at | -0.0055 | 0.9887 | |
| GSE20347 | LAMP1 | 3916 | 201553_s_at | -0.2136 | 0.2504 | |
| GSE23400 | LAMP1 | 3916 | 201553_s_at | -0.1054 | 0.1830 | |
| GSE26886 | LAMP1 | 3916 | 201553_s_at | -0.1344 | 0.2918 | |
| GSE29001 | LAMP1 | 3916 | 201553_s_at | -0.0609 | 0.7662 | |
| GSE38129 | LAMP1 | 3916 | 201553_s_at | -0.0731 | 0.6415 | |
| GSE45670 | LAMP1 | 3916 | 201553_s_at | -0.0016 | 0.9911 | |
| GSE53622 | LAMP1 | 3916 | 16198 | -0.1781 | 0.0630 | |
| GSE53624 | LAMP1 | 3916 | 16198 | -0.0173 | 0.8280 | |
| GSE63941 | LAMP1 | 3916 | 201553_s_at | -0.9086 | 0.0237 | |
| GSE77861 | LAMP1 | 3916 | 201553_s_at | -0.3289 | 0.2495 | |
| GSE97050 | LAMP1 | 3916 | A_23_P162846 | -0.2324 | 0.4929 | |
| SRP007169 | LAMP1 | 3916 | RNAseq | -1.1173 | 0.0076 | |
| SRP008496 | LAMP1 | 3916 | RNAseq | -1.1662 | 0.0000 | |
| SRP064894 | LAMP1 | 3916 | RNAseq | 0.5529 | 0.0002 | |
| SRP133303 | LAMP1 | 3916 | RNAseq | -0.0892 | 0.4606 | |
| SRP159526 | LAMP1 | 3916 | RNAseq | 0.0712 | 0.8097 | |
| SRP193095 | LAMP1 | 3916 | RNAseq | 0.0028 | 0.9880 | |
| SRP219564 | LAMP1 | 3916 | RNAseq | 0.4464 | 0.1258 | |
| TCGA | LAMP1 | 3916 | RNAseq | 0.0118 | 0.8183 |
Upregulated datasets: 0; Downregulated datasets: 2.
Survival by LAMP1 expression:
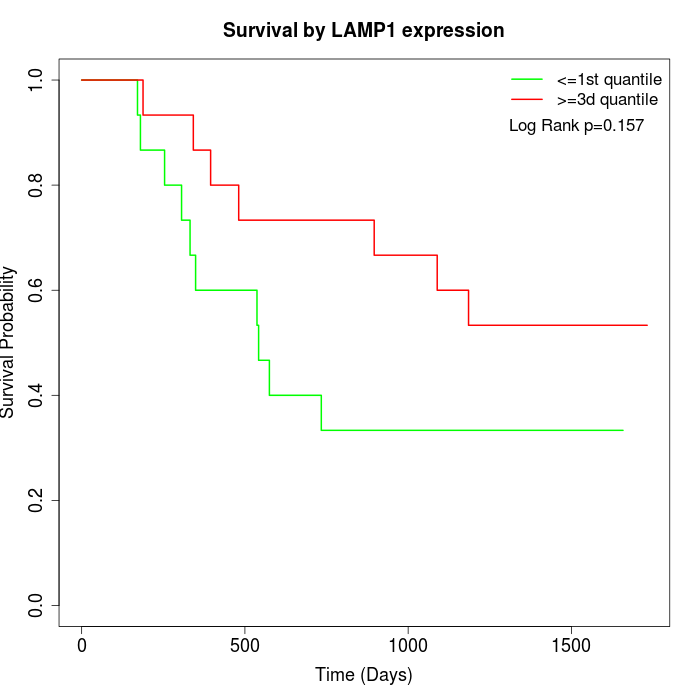 | 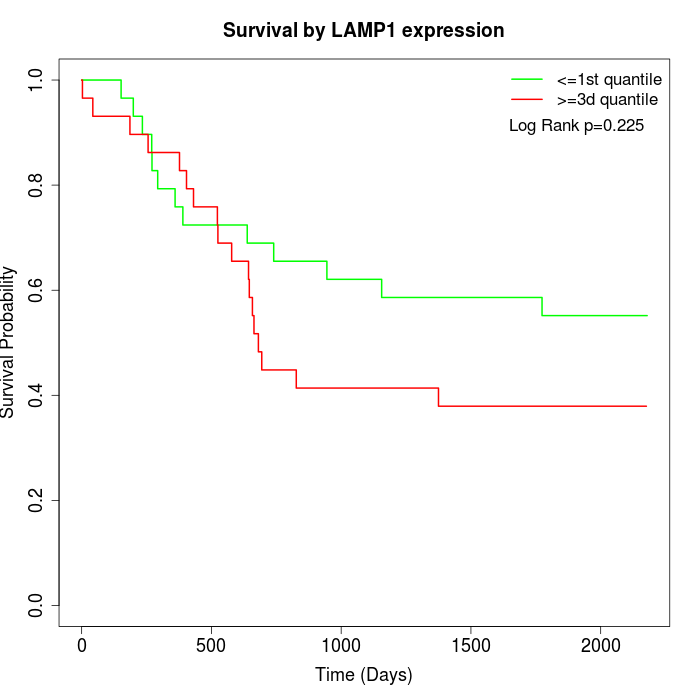 | 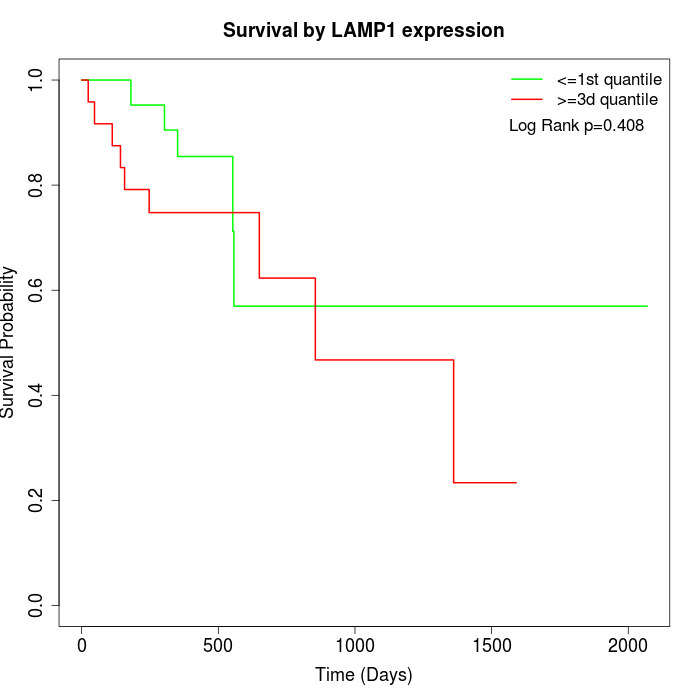 |
| GSE53622 | GSE53624 | TCGA |
Note: Click image to view full size file.
Copy number change of LAMP1:
| Dataset | Gene | EntrezID | Gain | Loss | Normal | Detail |
|---|---|---|---|---|---|---|
| GSE15526 | LAMP1 | 3916 | 7 | 12 | 11 | |
| GSE20123 | LAMP1 | 3916 | 7 | 11 | 12 | |
| GSE43470 | LAMP1 | 3916 | 4 | 14 | 25 | |
| GSE46452 | LAMP1 | 3916 | 3 | 31 | 25 | |
| GSE47630 | LAMP1 | 3916 | 3 | 26 | 11 | |
| GSE54993 | LAMP1 | 3916 | 11 | 4 | 55 | |
| GSE54994 | LAMP1 | 3916 | 9 | 10 | 34 | |
| GSE60625 | LAMP1 | 3916 | 0 | 3 | 8 | |
| GSE74703 | LAMP1 | 3916 | 3 | 11 | 22 | |
| GSE74704 | LAMP1 | 3916 | 4 | 9 | 7 | |
| TCGA | LAMP1 | 3916 | 20 | 31 | 45 |
Total number of gains: 71; Total number of losses: 162; Total Number of normals: 255.
Somatic mutations of LAMP1:
Generating mutation plots.
Highly correlated genes for LAMP1:
Showing top 20/191 corelated genes with mean PCC>0.5.
| Gene1 | Gene2 | Mean PCC | Num. Datasets | Num. PCC<0 | Num. PCC>0.5 |
|---|---|---|---|---|---|
| LAMP1 | MIER2 | 0.73495 | 3 | 0 | 3 |
| LAMP1 | RAB1B | 0.717959 | 3 | 0 | 3 |
| LAMP1 | RORA | 0.715042 | 3 | 0 | 3 |
| LAMP1 | AARS2 | 0.710657 | 3 | 0 | 3 |
| LAMP1 | DRD5 | 0.709403 | 3 | 0 | 3 |
| LAMP1 | TBC1D4 | 0.708343 | 3 | 0 | 3 |
| LAMP1 | TP53I11 | 0.705315 | 3 | 0 | 3 |
| LAMP1 | MINK1 | 0.702745 | 4 | 0 | 4 |
| LAMP1 | PIP4K2C | 0.700623 | 3 | 0 | 3 |
| LAMP1 | TMEM131 | 0.698097 | 3 | 0 | 3 |
| LAMP1 | MAN2B2 | 0.696397 | 5 | 0 | 4 |
| LAMP1 | SUGT1 | 0.69481 | 5 | 0 | 5 |
| LAMP1 | GLRX2 | 0.693445 | 3 | 0 | 3 |
| LAMP1 | ZNF578 | 0.691965 | 3 | 0 | 3 |
| LAMP1 | FBXO42 | 0.690523 | 3 | 0 | 3 |
| LAMP1 | UNC5B | 0.689378 | 3 | 0 | 3 |
| LAMP1 | HSD11B1 | 0.688782 | 3 | 0 | 3 |
| LAMP1 | COG6 | 0.684304 | 4 | 0 | 3 |
| LAMP1 | TMEM219 | 0.683842 | 3 | 0 | 3 |
| LAMP1 | MNT | 0.683794 | 3 | 0 | 3 |
For details and further investigation, click here