| Full name: MN1 proto-oncogene, transcriptional regulator | Alias Symbol: MGCR1-PEN|MGCR1 | ||
| Type: protein-coding gene | Cytoband: 22q12.1 | ||
| Entrez ID: 4330 | HGNC ID: HGNC:7180 | Ensembl Gene: ENSG00000169184 | OMIM ID: 156100 |
Expression of MN1:
| Dataset | Gene | EntrezID | Probe | Log2FC | Adj.pValue | Expression |
|---|---|---|---|---|---|---|
| GSE17351 | MN1 | 4330 | 205330_at | 0.0291 | 0.9766 | |
| GSE20347 | MN1 | 4330 | 205330_at | 0.1375 | 0.7189 | |
| GSE23400 | MN1 | 4330 | 205330_at | 0.1454 | 0.2889 | |
| GSE26886 | MN1 | 4330 | 205330_at | 1.0195 | 0.0082 | |
| GSE29001 | MN1 | 4330 | 205330_at | 0.4808 | 0.1292 | |
| GSE38129 | MN1 | 4330 | 205330_at | -0.2921 | 0.4421 | |
| GSE45670 | MN1 | 4330 | 205330_at | -0.1974 | 0.6087 | |
| GSE53622 | MN1 | 4330 | 112527 | -0.0826 | 0.6569 | |
| GSE53624 | MN1 | 4330 | 112527 | 0.1438 | 0.2262 | |
| GSE63941 | MN1 | 4330 | 205330_at | -1.6729 | 0.1815 | |
| GSE77861 | MN1 | 4330 | 205330_at | 1.3159 | 0.0119 | |
| GSE97050 | MN1 | 4330 | A_23_P6381 | -0.3907 | 0.2460 | |
| SRP007169 | MN1 | 4330 | RNAseq | 1.5093 | 0.0036 | |
| SRP008496 | MN1 | 4330 | RNAseq | 1.3346 | 0.0016 | |
| SRP064894 | MN1 | 4330 | RNAseq | 0.4775 | 0.1042 | |
| SRP133303 | MN1 | 4330 | RNAseq | 0.2623 | 0.4623 | |
| SRP159526 | MN1 | 4330 | RNAseq | 0.2441 | 0.5684 | |
| SRP193095 | MN1 | 4330 | RNAseq | 1.5918 | 0.0000 | |
| SRP219564 | MN1 | 4330 | RNAseq | -0.1032 | 0.8981 | |
| TCGA | MN1 | 4330 | RNAseq | 0.0879 | 0.5101 |
Upregulated datasets: 5; Downregulated datasets: 0.
Survival by MN1 expression:
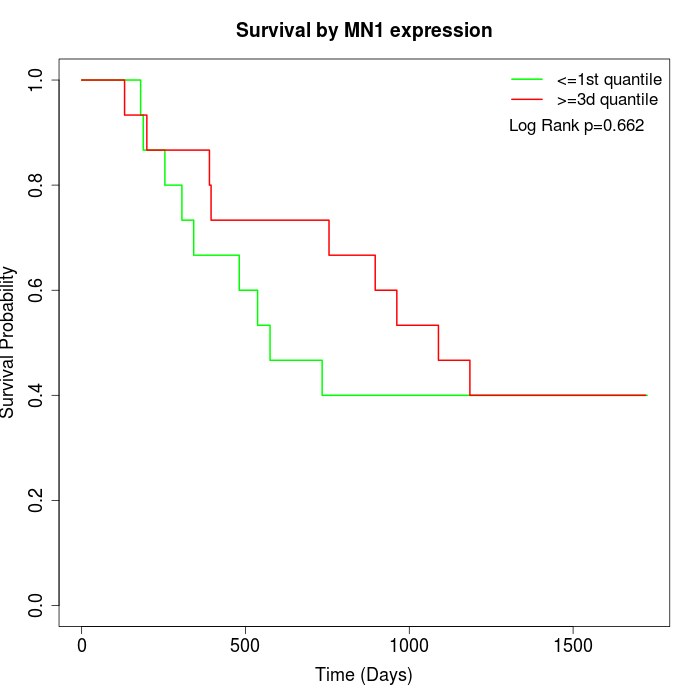 | 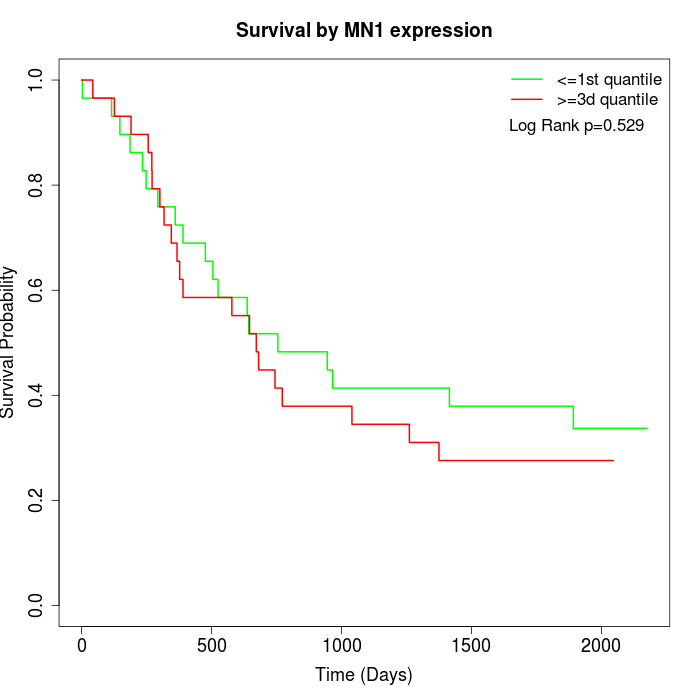 | 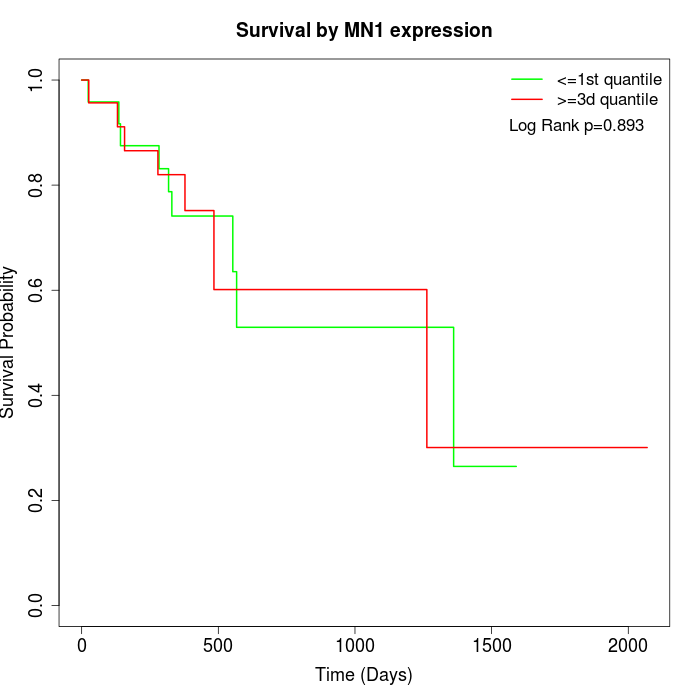 |
| GSE53622 | GSE53624 | TCGA |
Note: Click image to view full size file.
Copy number change of MN1:
| Dataset | Gene | EntrezID | Gain | Loss | Normal | Detail |
|---|---|---|---|---|---|---|
| GSE15526 | MN1 | 4330 | 2 | 4 | 24 | |
| GSE20123 | MN1 | 4330 | 2 | 3 | 25 | |
| GSE43470 | MN1 | 4330 | 3 | 6 | 34 | |
| GSE46452 | MN1 | 4330 | 31 | 1 | 27 | |
| GSE47630 | MN1 | 4330 | 8 | 5 | 27 | |
| GSE54993 | MN1 | 4330 | 3 | 6 | 61 | |
| GSE54994 | MN1 | 4330 | 11 | 8 | 34 | |
| GSE60625 | MN1 | 4330 | 5 | 0 | 6 | |
| GSE74703 | MN1 | 4330 | 3 | 5 | 28 | |
| GSE74704 | MN1 | 4330 | 0 | 1 | 19 | |
| TCGA | MN1 | 4330 | 27 | 16 | 53 |
Total number of gains: 95; Total number of losses: 55; Total Number of normals: 338.
Somatic mutations of MN1:
Generating mutation plots.
Highly correlated genes for MN1:
Showing top 20/502 corelated genes with mean PCC>0.5.
| Gene1 | Gene2 | Mean PCC | Num. Datasets | Num. PCC<0 | Num. PCC>0.5 |
|---|---|---|---|---|---|
| MN1 | AKAP8 | 0.751766 | 3 | 0 | 3 |
| MN1 | MFHAS1 | 0.710914 | 3 | 0 | 3 |
| MN1 | EIF5 | 0.70539 | 3 | 0 | 3 |
| MN1 | SMCR8 | 0.704108 | 3 | 0 | 3 |
| MN1 | LSM10 | 0.698237 | 3 | 0 | 3 |
| MN1 | GMEB2 | 0.698167 | 3 | 0 | 3 |
| MN1 | PACSIN2 | 0.697864 | 5 | 0 | 5 |
| MN1 | RAD23A | 0.69746 | 3 | 0 | 3 |
| MN1 | PUM1 | 0.692931 | 3 | 0 | 3 |
| MN1 | MCAM | 0.69206 | 5 | 0 | 5 |
| MN1 | EIF3G | 0.685669 | 4 | 0 | 3 |
| MN1 | SCRG1 | 0.681903 | 3 | 0 | 3 |
| MN1 | PKN1 | 0.672635 | 3 | 0 | 3 |
| MN1 | RABEP1 | 0.670036 | 3 | 0 | 3 |
| MN1 | CNTLN | 0.66747 | 3 | 0 | 3 |
| MN1 | PPP1R12B | 0.667401 | 3 | 0 | 3 |
| MN1 | ANG | 0.667273 | 4 | 0 | 4 |
| MN1 | FXYD6 | 0.667057 | 5 | 0 | 4 |
| MN1 | CHD4 | 0.665965 | 3 | 0 | 3 |
| MN1 | MAML1 | 0.664091 | 3 | 0 | 3 |
For details and further investigation, click here