| Full name: transmembrane protein 39B | Alias Symbol: FLJ10315 | ||
| Type: protein-coding gene | Cytoband: 1p35.2 | ||
| Entrez ID: 55116 | HGNC ID: HGNC:25510 | Ensembl Gene: ENSG00000121775 | OMIM ID: |
Expression of TMEM39B:
| Dataset | Gene | EntrezID | Probe | Log2FC | Adj.pValue | Expression |
|---|---|---|---|---|---|---|
| GSE17351 | TMEM39B | 55116 | 218770_s_at | 0.5172 | 0.0791 | |
| GSE20347 | TMEM39B | 55116 | 218770_s_at | 0.5306 | 0.0014 | |
| GSE23400 | TMEM39B | 55116 | 218770_s_at | 0.3203 | 0.0000 | |
| GSE26886 | TMEM39B | 55116 | 218770_s_at | 0.4119 | 0.0086 | |
| GSE29001 | TMEM39B | 55116 | 218770_s_at | 0.5760 | 0.0041 | |
| GSE38129 | TMEM39B | 55116 | 218770_s_at | 0.6037 | 0.0000 | |
| GSE45670 | TMEM39B | 55116 | 218770_s_at | 0.4552 | 0.0041 | |
| GSE53622 | TMEM39B | 55116 | 66671 | 0.4372 | 0.0000 | |
| GSE53624 | TMEM39B | 55116 | 66671 | 0.6382 | 0.0000 | |
| GSE63941 | TMEM39B | 55116 | 218770_s_at | 0.3825 | 0.4162 | |
| GSE77861 | TMEM39B | 55116 | 218770_s_at | 0.3060 | 0.2608 | |
| GSE97050 | TMEM39B | 55116 | A_23_P34496 | 0.3102 | 0.3833 | |
| SRP007169 | TMEM39B | 55116 | RNAseq | 0.4187 | 0.4485 | |
| SRP008496 | TMEM39B | 55116 | RNAseq | 0.5250 | 0.2261 | |
| SRP064894 | TMEM39B | 55116 | RNAseq | 1.2613 | 0.0000 | |
| SRP133303 | TMEM39B | 55116 | RNAseq | 0.2478 | 0.1049 | |
| SRP159526 | TMEM39B | 55116 | RNAseq | 0.5757 | 0.1214 | |
| SRP193095 | TMEM39B | 55116 | RNAseq | 0.4225 | 0.0000 | |
| SRP219564 | TMEM39B | 55116 | RNAseq | 0.4236 | 0.1537 | |
| TCGA | TMEM39B | 55116 | RNAseq | 0.2700 | 0.0000 |
Upregulated datasets: 1; Downregulated datasets: 0.
Survival by TMEM39B expression:
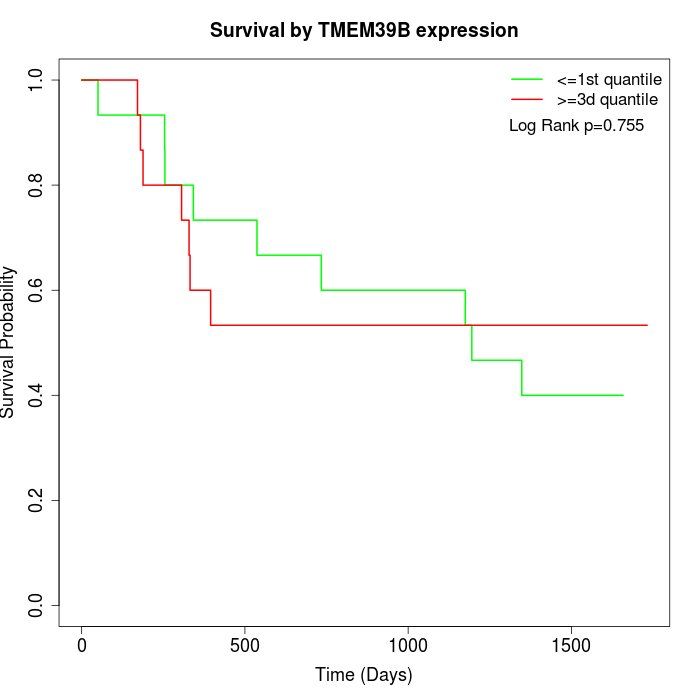 | 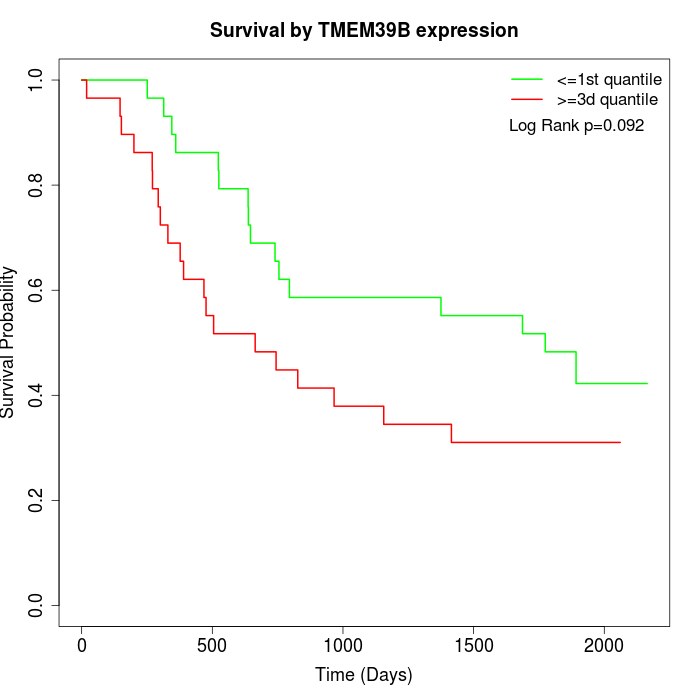 | 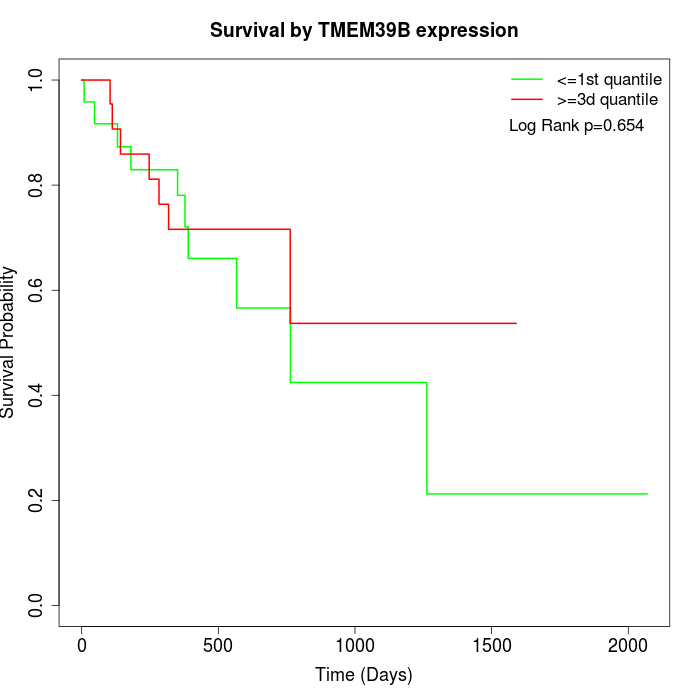 |
| GSE53622 | GSE53624 | TCGA |
Note: Click image to view full size file.
Copy number change of TMEM39B:
| Dataset | Gene | EntrezID | Gain | Loss | Normal | Detail |
|---|---|---|---|---|---|---|
| GSE15526 | TMEM39B | 55116 | 1 | 5 | 24 | |
| GSE20123 | TMEM39B | 55116 | 1 | 4 | 25 | |
| GSE43470 | TMEM39B | 55116 | 6 | 4 | 33 | |
| GSE46452 | TMEM39B | 55116 | 5 | 1 | 53 | |
| GSE47630 | TMEM39B | 55116 | 8 | 3 | 29 | |
| GSE54993 | TMEM39B | 55116 | 1 | 1 | 68 | |
| GSE54994 | TMEM39B | 55116 | 11 | 2 | 40 | |
| GSE60625 | TMEM39B | 55116 | 0 | 0 | 11 | |
| GSE74703 | TMEM39B | 55116 | 4 | 3 | 29 | |
| GSE74704 | TMEM39B | 55116 | 0 | 0 | 20 | |
| TCGA | TMEM39B | 55116 | 11 | 21 | 64 |
Total number of gains: 48; Total number of losses: 44; Total Number of normals: 396.
Somatic mutations of TMEM39B:
Generating mutation plots.
Highly correlated genes for TMEM39B:
Showing top 20/1239 corelated genes with mean PCC>0.5.
| Gene1 | Gene2 | Mean PCC | Num. Datasets | Num. PCC<0 | Num. PCC>0.5 |
|---|---|---|---|---|---|
| TMEM39B | KIF2C | 0.669464 | 12 | 0 | 11 |
| TMEM39B | PTK7 | 0.669071 | 11 | 0 | 10 |
| TMEM39B | PSMB2 | 0.667471 | 12 | 0 | 11 |
| TMEM39B | YBX1 | 0.665755 | 8 | 0 | 8 |
| TMEM39B | TUBA1C | 0.659484 | 7 | 0 | 6 |
| TMEM39B | UBE2C | 0.657715 | 12 | 0 | 11 |
| TMEM39B | PLXNA1 | 0.657699 | 10 | 0 | 10 |
| TMEM39B | CDC20 | 0.654964 | 11 | 0 | 10 |
| TMEM39B | LRR1 | 0.654195 | 4 | 0 | 4 |
| TMEM39B | WDR54 | 0.653963 | 6 | 0 | 5 |
| TMEM39B | PRR12 | 0.652692 | 3 | 0 | 3 |
| TMEM39B | MCM2 | 0.650454 | 11 | 0 | 9 |
| TMEM39B | NAT14 | 0.650296 | 6 | 0 | 6 |
| TMEM39B | LSAMP-AS1 | 0.649628 | 3 | 0 | 3 |
| TMEM39B | KDM1A | 0.648442 | 11 | 0 | 9 |
| TMEM39B | RPN1 | 0.647834 | 10 | 0 | 9 |
| TMEM39B | EHMT2 | 0.647695 | 6 | 0 | 5 |
| TMEM39B | MND1 | 0.647663 | 6 | 0 | 5 |
| TMEM39B | KNSTRN | 0.645763 | 5 | 0 | 4 |
| TMEM39B | NASP | 0.641494 | 12 | 0 | 10 |
For details and further investigation, click here